Well, it’s finally time to look into the snowfall data for this winter across the Prairies with a particular emphasis on our own region: agricultural Manitoba. As you already know, snowfall amounts are difficult to measure. I have written about this in the past and anyone who goes outside in the winter knows how much snow depth can vary. It is the very nature of snow itself. It is light and is easily moved around by the wind, which we have also seen a lot of lately. Over the last month or so, there has been an increasing number of articles on how much snow some regions of Manitoba have received this winter — particularly in Winnipeg, since the largest portion of the province’s population is located there.
Read Also
Forecasting spring 2026 weather on the Prairies
What weather can farmers expect across Manitoba, Alberta and Saskatchewan as they head into seeding? Plus: a lesson on what makes the seasons turn
When we look at snowfall it can be measured in a couple of ways. One method is to simply measure how much fell on a flat surface. This is almost always measured in centimetres. This type of measurement is nice when you are just talking about the snow but is not overly useful when it comes to how that snow will behave and what its impact on agricultural and hydrological systems will be when it melts. Snow can range from very dense and wet to very light and fluffy. Heavy, wet snow will stay put and not blow around, whereas dry, fluffy snow is easily transported by even the lightest of breezes. This means that the heavier and wetter the snow, the easier it is to measure, while light, fluffy snow is notoriously difficult. A light, fluffy snowfall accompanied by winds can cause snowfall amounts measured on the ground to range from zero new snow in some areas to two or more times as much snow in other areas. In Manitoba we mostly get light, fluffy snow, and this is why it is so difficult to accurately measure snow.
One of the ways around this issue of blowing snow is to measure the amount of water contained in the snow. This can be done by taking a cylinder of the fallen snow and melting it down. This method is still subject to variations in snowfall amount from wind. A second method is to melt the snow as it falls. This second method tends to be more accurate but, depending on the setup, is still subject to blowing snow. This melted snow is then converted back into an amount of snow by using a ratio. The typical ratio used is 10:1. That is, one millimetre of water is equal to 10 mm of snow, or one mm of water equals one cm of snow. This number is an average number and can range from 3:1 for very wet snow, all the way to 30 or even 40:1 for very dry, fluffy snow. Snow that is blown and hard packed will often be in the 6:1 to 8:1 ratio.
As I was reading these various snowfall articles, I noticed they were all referencing snowfall data from Winnipeg and seemed to be reporting fairly high amounts. I went to Environment Canada’s website and tried to figure out where this data was coming from. I first checked the airport data — the data that is usually reported to the public for temperature, rainfall, humidity, et cetera. That data did not match what was being reported. I then checked The Forks station, which is in downtown Winnipeg, meaning it is not subject to as much wind and blowing snow. Its data also did not match. Finally, I checked the Charleswood station data, which just reports precipitation, and bingo, it was a match. Turns out, this weather station is run by retired Environment Canada meteorologist Rob Paolo, which leads me to believe that the observations and recordings for this location should be fairly accurate. My only concern is that all the data coming from this site uses the 10:1 ratio. So, while the actual amount or depth of snow is probably accurate, the total water content of the snow may not be.
Distribution
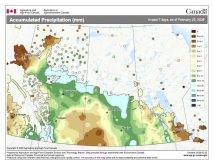
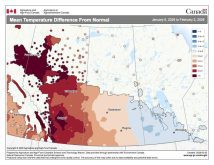
OK, enough with the problems associated with measuring snow. The question is, just how much snow have we seen this winter? On this page I have included a map produced by Environment Canada that shows the total amount of snow on the ground on March 14. This is just before widespread snowmelt began across Manitoba. The one thing that really stands out is the distribution of the snow cover. You can easily see the main winter storm track that saw storm systems move from central or northern Alberta southeastward across the Prairies. I should point out that I have to clean up the map a fair bit to make it easier to read. This means I had to simplify the data, so some areas might not be represented correctly, but the overall pattern is fairly accurate. Also, this map shows the amount that is on the ground, not how much fell over the winter.
Regardless of the issue of measuring snow as it falls, one of the best ways to know how much water is in an entire snowpack is to do a snow course — that is, you systematically take samples of the snow by pulling out a cylinder of snow stretching from the ground to the top of the snow. You then melt this down to determine the total water content. This is done over a large area and then averaged out. This should help to smooth out the data between areas where snow drifted and other areas where it mostly blew away. I thought about doing this across my 10-acre property, but I simply do not have the time or equipment. That’s the problem with this method: it takes a lot of time and people power, which means it is expensive.
I hate to say it, but once again I have run out of room. This means the big dig into the snowfall data will have to wait until the next article. Until then, for those of you who have more snow than you know what to do with, let’s hope that the spring melt continues to be slow and steady.