I know I promised to dig into a month-by-month summary of last year’s weather across the Prairies, and I will get to it. First, I have received several emails and have overheard plenty of conversations about wind chill over the last week. Some of the emails ask about just what windchill is, but most ask for clarification on whether a -52 C wind chill really means it is -52 C outside. So let’s do a quick look at this topic before the 2023 weather summary.
When we talk about apparent temperature — what it feels like, we are taking into account the water vapour in the air, wind speed and the actual air temperature. In the winter, we call this measurement wind chill. The explorer Paul Siple first introduced the idea of a wind chill factor in 1939. It indicates the enhanced rate at which the body will lose heat to the air. Our bodies help keep us warm in the winter by trapping a thin layer of air near the surface of our skin. When it’s windy, this thin layer is taken away and additional heat from our bodies is released to try and recreate this layer. This process repeats itself over and over, the higher the wind speed and the faster the warm air is pulled away. In addition, moisture from our bodies is being evaporated, a process that uses up even more heat from our bodies. In 1970 a formula was developed to calculate the rate of heat lost, and in 2001 the wind chill formula was revised into what we see and hear about today.
What still can’t be built into the formula is a person’s physical activity, the sun’s intensity, and the protective clothing being worn. All these things can decrease the cooling effect of those cold winter winds, and this is where the problem seems to arise. What I mostly have an issue with, is how the media uses and reports wind chill.
Read Also
Why is the sky blue?
The colour of the skies, on the Prairies and elsewhere, tells the story of the paths sunlight takes as it enters Earth’s atmosphere, Daniel Bezte writes.
The biggest problem is that they often don’t understand how wind chill works and tend to apply it to an inanimate object such as a vehicle. It just doesn’t work that way. Objects can only get as cold as the air temperature. If the wind chill indicates that it feels like it is -52 C but the air temperature is -30 C, then the coldest an object can get is -30 C, this includes people. What the -52 C means is that you will be losing heat from exposed areas at a rate equivalent to an air temperature that is -52 C, but once you hit -30 C the object cannot get any colder. So, you or your car might cool quicker, but it won’t drop below the actual air temperature.
OK, now on to our review of last year’s weather. When looking at this, I thought, to make things easier I would put some of the key weather data into a couple of graphs. As you know, I often run out of room writing these articles, and as you know, pictures are worth a thousand words. Also, a lot of us are visual learners — that’s my teacher coming through. I picked one location per province: Winnipeg, Regina and Calgary. If you take a quick look at the first graph you can see how surprisingly similar they are.
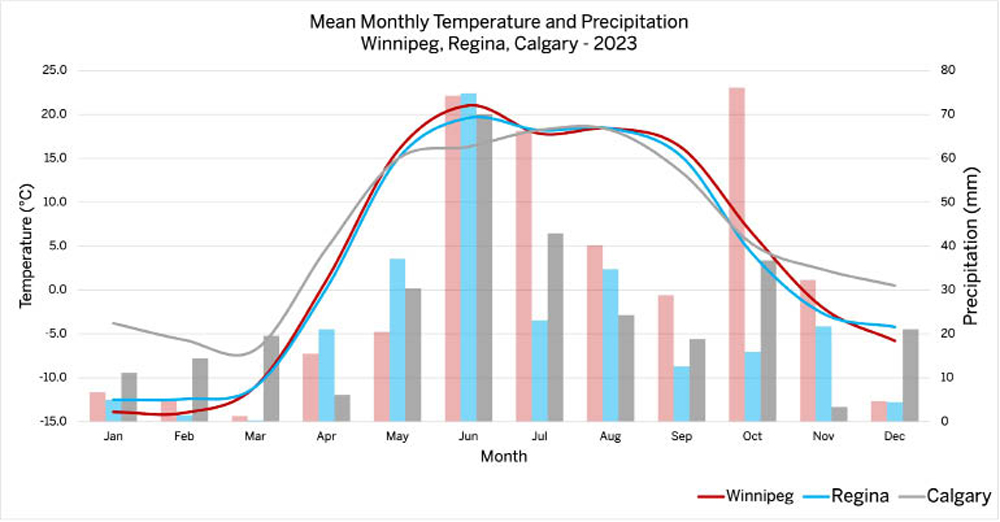
The first graph (above) shows the mean monthly temperature for each month (line graph) along with the total precipitation for each month (bar graph). As I pointed out above, the data is very similar across all three locations, which indicates a very similar weather pattern across all three provinces. When looking at the temperatures, two things stand out. The first is that Calgary is much warmer than both Regina and Winnipeg in the winter, but I think most of us already knew that. The second interesting item is that the peak monthly temperature occurred in June rather than July. I think we can all remember back to just how hot June was.
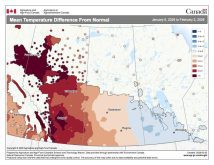
If you jump to the second graph (below), you will see the departure from average temperature for each month. From this you can see that the year starts off warmer than average with temperatures then sliding to well below average in March and April. The big warmup occurred in May, with temperatures rebounding to well above average, and these warm temperatures continued into June. July saw a return to below-average values with the exception of Calgary, which continued with above-average temperatures. Above-average temperatures returned to all three provinces in September before another cool-down in October. Then, as we all can remember, winter didn’t want to move in during November and December and as a result, temperatures returned to well above average.
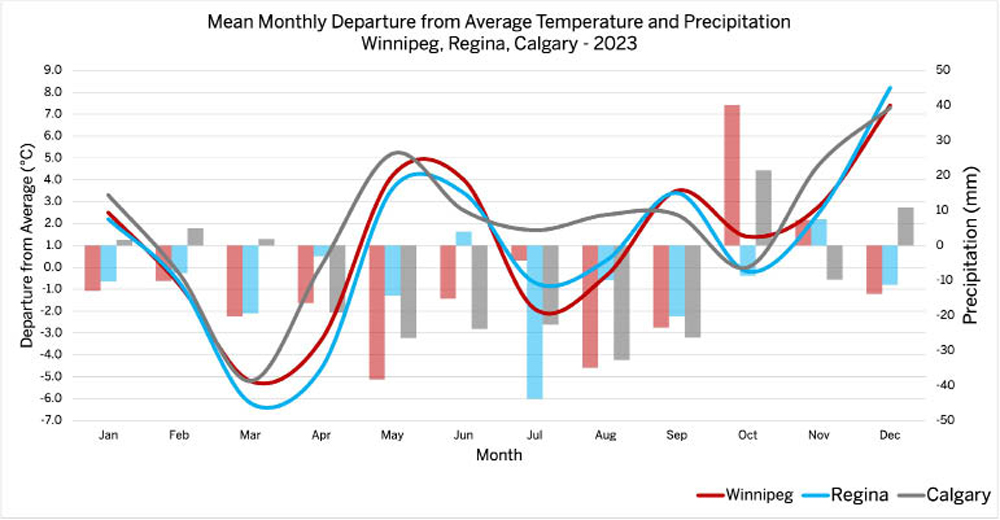
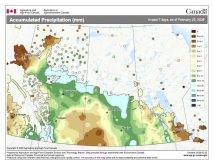
Looking back at the first graph which shows the total monthly precipitation in 2023, you can again see that with the exception of a couple of months and only one or so stations, total monthly precipitation throughout the year was very similar. The two months that stand out are July and October, where Winnipeg received significantly more precipitation than both Regina and Calgary. If I had included Edmonton, then June would have stood out, as that region received about 150 mm of rainfall. If we look at the second graph which shows the departure from average precipitation, then you can really see how dry the year was. Almost every month had below-average precipitation with only October showing precipitation totals in Winnipeg and Calgary significantly above average.
Overall, 2023 was a warm and dry year across the Prairies. Of particular note was the extreme heat during the second half of May and through much of June. For those who were looking forward to getting out into the heat of summer in July, there was a little disappointment, as cool weather helped dampen things. The question now forming on nearly everyone’s mind is whether the warm, or rather the just dry, weather will continue. After all, a crop has never been determined by the January and February weather. I will take a look at that topic sometime in the next couple of weeks. Next week I think I might have to re-examine just what is a polar vortex since it has once again made the news as it brought extreme cold to the western half of the Prairies and much of B.C. Until then, stay warm!