Supporters of the Stronger In Campaign react as results of the EU referendum 
are announced at the Royal Festival Hall, in London.

Brexit fallout extends to Prairie farms

Commodity markets are roiling and key trade deals are in jeopardy

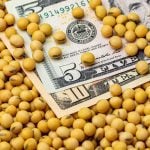
Britain’s decision to leave the European Union threw key trade deals in jeopardy while sending shock waves through global financial and commodity markets last week. Most equities and commodities, including wheat, corn and soybeans, dropped sharply in trade the day after the June 23 referendum, while traditional safe-haven investments like gold and the U.S. dollar

Soybean meal monthly nearby. (chart as of May 25, 2016)

Drozd: Two-month reversal forewarns livestock producers to higher meal prices

The meal market was technically oversold which created the opportunity for a short covering rally

Sometimes it just does not pay to ignore what the charts are telling you. Case in point, soybean meal futures exploded higher after a two-month reversal materialized on the monthly nearby futures chart. This reversal pattern indicated a change in trend and is illustrated in the accompanying chart. Since its development on March 31, the


Drozd: Anemic corn market showing signs of life

Drozd: Anemic corn market showing signs of life

Price improvements are coming despite anticipated large ending stocks for 2015-16

Corn futures at the Chicago Board of Trade rallied to a nine-month high in April 2016. The 55-cent-per-bushel gain may have come as a surprise to some market participants, given USDA is forecasting global corn ending stocks to be record large in 2015-16. However, there were signs the market had stopped going down, at least

Livestock Cattle Weekly Nearby – chart as of February 22, 2016.

Drozd: Reversal patterns alert cattle producers to market downturn

Cattle markets took a sudden downturn in October 2014, catching many producers off guard

The live cattle market has been under pressure since the nearby futures market at the CME peaked at $171.975 per hundredweight in October 2014. In the 14 months that followed, prices on the weekly nearby live cattle futures chart plummeted $55/cwt to $116.975/cwt, before recovering $20 per hundredweight. Although the downturn was sudden, and may


Crude oil monthly nearby (chart as of January 22, 2016).

Drozd: When crude oil slipped below $27 per barrel

Producers who 18 months ago recognized the impending downturn in the crude oil market, were able to position themselves

The price of crude oil has dropped $80 per barrel in the past 18 months. In July 2014, a two-month reversal materialized in the accompanying long-term chart indicating the crude oil market was about to turn down from $106 per barrel. Once prices fell below an important line of support in the $96-per-barrel area (shown

Canadian dollar monthly nearby. (chart as of Dec. 28, 2015)

Drozd: Canadian dollar falls to an 11-year low

There are advantages and disadvantages for agriculture

The Canadian dollar continues to erode on the heels of falling commodity prices. A year ago, the Canadian dollar was 86 cents against the American dollar. Today it is closer to 72 cents U.S. The weakness in crude oil and gold have contributed to the collapse of the loonie. Canada is a country rich in


CME soybean monthly nearby (chart as of November 25, 2015).

Drozd: Bear market intact with soybean market

The soybean market has lost 53 per cent of its value since its peak in 2012

The soybean market has been under pressure since it topped out at the historical high of 17.945 on September 4, 2012. This was a pivotal day, as it marked the end of the bull market rally and the beginning of the ensuing bear market. Now down to $8.44, the soybean futures market has lost 53

CME Lean Hog Weekly nearby (chart as of Oct. 28, 2015)

Drozd: Reversal pattern alerts producers to downturn in lean hog market

The hog market took four years to climb, but only nine months to fall back

Lean hog futures have been on a slippery slope since the bull market rally ended in July 2014. The nearby futures contract went from a historical high of $133.875 per hundredweight to $57.775, losing 57 per cent of its value in only nine months. To put the enormity of this collapse in perspective, it took


Canola, November 2015.

Drozd: Double top signals an end to the weather market rally in canola

Weather market rallies seldom last for long. Emotions run high, causing the rally to end just as suddenly as it began

Chart analysts keen on the lookout for telltale signs of a market top in canola were rewarded when a reversal pattern called a double top appeared at the height of the rally in July 2015. Double tops and bottoms are chart formations which appear in the futures markets. Once completed, they are a reliable indicator

John De Pape discussed the cash grain price service he is working on for the Alberta Wheat Commission during the Keystone Agricultural Producers’ General Council meeting in April.

Cash grain price service up and running

More information is coming

Economists agree key to a successful open grain market is, well, openness, which includes easy access to accurate market information such as cash prices. To that end the Alberta Wheat Commission (AWC) launched the first phase of its free, new web-based Crop Data and Price Reporting initiative Sept. 8. Price & Data Quotes (PDQ) aims