The price of crude oil has dropped $80 per barrel in the past 18 months.
In July 2014, a two-month reversal materialized in the accompanying long-term chart indicating the crude oil market was about to turn down from $106 per barrel. Once prices fell below an important line of support in the $96-per-barrel area (shown as A), sell stops were triggered, causing prices to plummet to a long-term line of support in the $46-per-barrel area (shown as B).
Then, after having a “dead cat bounce” (minor bounce) to $62 per barrel, the market resumed the downtrend, dropped below the major long-term line of support (B), and collapsed to $26.16 per barrel on January 20, 2016 before encountering another reaction.
Read Also
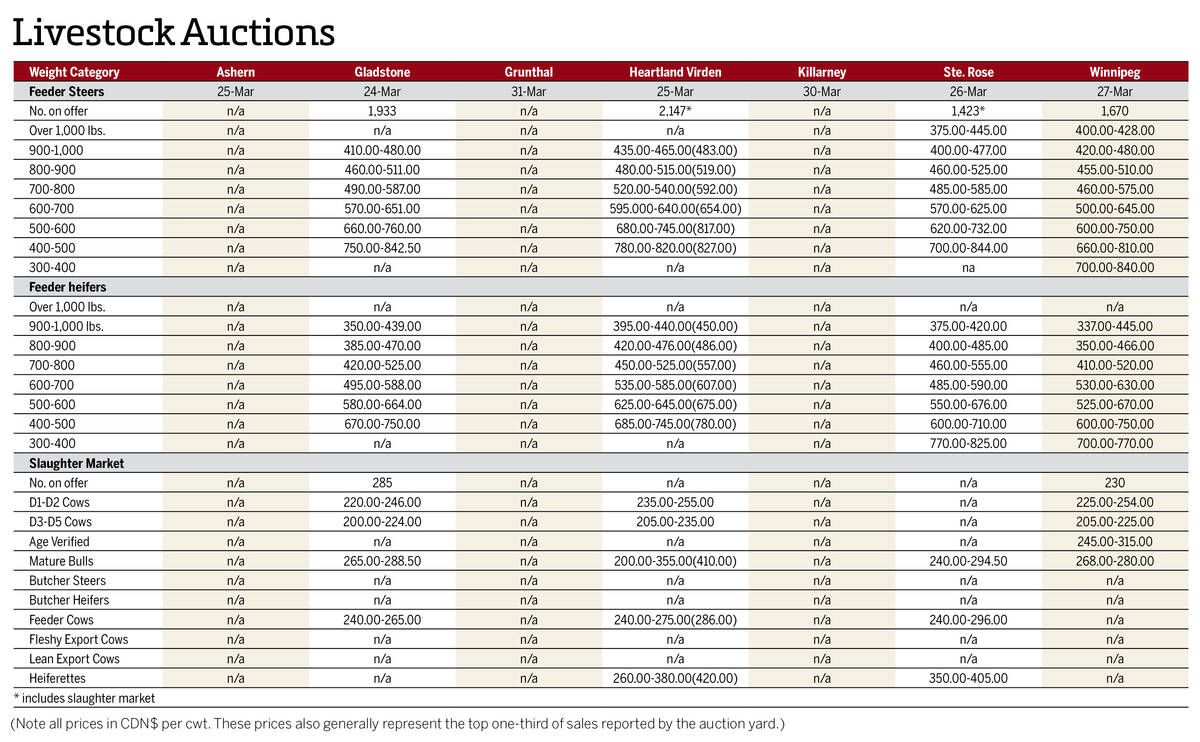
Manitoba cattle prices April 1
Here’s what cattle were selling for in Manitoba from March 24-31, 2026. Four of the seven main livestock auction marts held sales.
Support
Support is a term used to describe a price level where the buying of futures contracts is expected to noticeably increase and at least temporarily halt the current direction of the market.
On bar charts, these areas will appear as well-defined price ranges within which the market previously traded essentially sideways or higher prior to making a decisive move down. The greater the amount of time the line of support persists, the greater will be the potential for support or resistance in the future.
To illustrate; crude oil prices were supported by line (A) for five years. Once prices fell below $96, thus breaking the line of support, then $96 became resistance on the following upward reaction.
Another characteristic which helps to gauge the relative support of a price area is the vertical distance the market must fall prior to reaching the area in question. The greater the market decline, prior to reaching a support level, the greater should be the support at that area.
To exemplify this characteristic; after the crude oil market broke down below support at $96 per barrel, the market plummeted $60 before bouncing off a major line of support (B), which had persisted for 16 years.
Lines of support, once identified, prove to be reliable indicators of future price direction.
Market psychology
Support areas evolve because the market attracts buying around the bottom of a range. If prices break down through the line of support, shown as (A) in the accompanying chart, then all recent buyers are holding losing positions. Any return move back to this area subsequently represents an area in which to liquidate a long position at break-even or with a reduced loss. Therefore, the area where contracts are offered for sale increases and becomes resistance. Also, those who sold at higher levels, now have profits and may use the bounce to add to their short position.
The concept of support and resistance and the market’s reaction when it moves into a support or resistance area are among the most interesting facets of chart study. Where a classic formation may not appear on a chart for several months, one can be reasonably sure that there is always a support or resistance area, even if minor, not very far from the market. This is important because it can help one formulate expectations of future price action.
Support or resistance areas are commonplace on futures charts, but are extremely important as they illustrate where future rallies and declines are likely to fail. Support and resistance levels define the parameters of the major trend.
It is important for producers to recognize the trend in the crude oil market and to understand its significant influence on the Canadian dollar and subsequent impact on agriculture. Producers who, 18 months ago, recognized the impending downturn in the crude oil market, were able to position themselves for the anticipated decline of not only crude oil, but the Canadian dollar as well.
Send your questions or comments about this article and chart to [email protected].