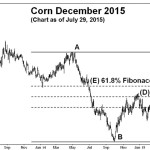
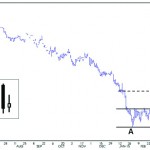
Drozd: Corn market plummets after rallying to a one-year high

Drozd: Corn market plummets after rallying to a one-year high

Faced with the realization that a weather market can end as quickly as it began, 
farmers have the daunting task of figuring out when to sell

It took the corn market three weeks to rally 75 cents per bushel and only two weeks to plummet just as far. When markets go down faster than they go up, farmers may have a difficult time taking advantage of a steep market rally like this. Farmers get busy and may not have got around

chart showing Canadian dollar value

Drozd: Harami alerts producers to impending rally in the Canadian dollar

A harami that occurs at the end of a significant move down in price and time 
will have more reliability than any other place on a chart

The Canadian dollar has rallied nearly 600 basis points in the past six weeks. This rally may have come as a surprise to some people, but not to those studying candlestick charting. The Japanese are regarded as the true pioneers of candlestick charting. The Japanese method of charting is called candlestick because the individual lines


April live cattle futures post new contract low in first quarter of 2013

A drop of $13 per hwt is a classic example of the market topping out when the news is the most bullish

Live cattle prices have been under pressure since peaking in December amid bullish headlines and news that took prices to historic highs. Cattle and calves in the United States according to USDA estimates as of January 1, 2013 totalled 89.3 million head, which is two per cent below the 90.8-million figure recorded a year earlier.


Analyzing the loonie’s move to below par

The Canadian dollar has been trending lower, since it penetrated the lower boundary of the uptrending channel. I have found that chart analysis is a valuable resource for determining the price trend and where support and resistance to the trend may be anticipated. Trendlines During the course of a trend and all the fluctuations which

Classic topping action in soybean meal

Each day’s prices and the pattern configurations are a direct result of human decisions to buy and sell

Technical analysis is the study of market movement. Its strength and popularity comes from the assumption that future price direction can be predicted by studying a market’s past activity. Technical analysis is concerned exclusively with the market and certain statistics the market generates — prices, volume and open interest. In technical analysis, no consideration is


Spring wheat posts its highest price of open-market era

Watch for rising wedges in bear markets and falling wedges in bull markets, where they are most apt to occur

Red spring wheat grading No. 1 13.5 per cent protein reached $8 per bushel for the 2012-13 crop year. This is the highest price farmers have been able to lock in, since the open-market era was announced in mid-December 2011. True to form, wheat prices began their seasonal turn higher, just as the U.S. winter

A classic head and shoulders confirmed downturn

To those less familiar with charting and technical analysis, the recent drop in oat prices may have come as a bit of a surprise. What I have found in my 30 years’ experience, is that even though the oat futures market has a relatively small amount of open interest compared to actively traded commodities such


Harami alerts hog producers to a downward correction

After rallying up, but failing to fill a gap between $91.475 and $91.650, lean hog prices on the weekly nearby candlestick chart turned back down on February 24, 2012. The ensuing reversal pattern (sell signal) that developed is referred to as a harami on a candlestick chart. Lean hog prices have since lost more than