oats market graph

Drozd: Oat market hammers out a bottom

Bottoming action is evident in the December 2015 oat futures market

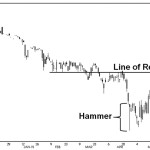
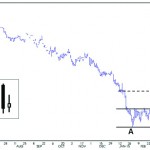
A hammer materialized on the December oat futures chart on Monday, April 27, 2015. Hammers are reversal patterns that appear at market bottoms on candlestick charts and are bullish, as they are said to be “hammering out a bottom.” The hammer represents a period in the market where an intraday sell-off is met with strong

chart showing Canadian dollar value

Drozd: Harami alerts producers to impending rally in the Canadian dollar

A harami that occurs at the end of a significant move down in price and time 
will have more reliability than any other place on a chart

The Canadian dollar has rallied nearly 600 basis points in the past six weeks. This rally may have come as a surprise to some people, but not to those studying candlestick charting. The Japanese are regarded as the true pioneers of candlestick charting. The Japanese method of charting is called candlestick because the individual lines


Harami alerts hog producers to a downward correction

After rallying up, but failing to fill a gap between $91.475 and $91.650, lean hog prices on the weekly nearby candlestick chart turned back down on February 24, 2012. The ensuing reversal pattern (sell signal) that developed is referred to as a harami on a candlestick chart. Lean hog prices have since lost more than

Topping Action In Soybean Meal Sends Calming Signal

Livestock producers were left scratching their heads when the December 2011 soybean meal futures contract posted a new high in late August. The news was incredibly bullish, as concerns of an early frost were on producers minds. The big question was, Should I be locking in the price of meal before it gets any higher?


Harami Predicted A Strong U.S. Dollar

You d be hard pressed to find anyone this summer who wasn t aware of the United States escalating debt, increasing unemployment and home foreclosures that produced the current economic slowdown. All summer, as the news grew increasingly bearish, with newspaper headlines suggesting the greenback was about to crash and burn, more market analysts began

Bull Market In Corn Resumes After Seasonal Downturn

It appears the seasonal tendency for corn prices to move lower in March may be over, due to the bears being unable to push prices below an important line of support on the December 2011 futures contract. This is also the point at which a reversal pattern called a harami materialized on the candlestick chart.


Oat Prices Explode On A Short Covering Rally

David drozd Although the oat futures market is the most thinly traded cereal grain market in Chicago, it still provides reliable chart patterns and technical signals on when to buy and sell. Reading a chart is much like reading a road map. It tells you where prices are going to go. Let’s begin this journey

Harami Warns Farmers Of An Impending Collapse In Oat Prices

David drozd The Japanese are true pioneers of technical analysis of the markets. You may remember last month’s column where I illustrated the weekly canola chart and identified the two-week reversal that materialized at the height of the rally in early January. Similarly, another reversal pattern known as a harami also developed at the end


Harami Warns Farmers Of Impending Drop In Wheat Prices

David drozd As I have mentioned before in this column, the Japanese are true pioneers of technical analysis of the markets. Their techniques have evolved from fairly simple beginnings, trading forward rice contracts (futures) in the 17th century, to now include many sophisticated ways to analyze the markets, including the amazingly powerful modern-day charting method

T – for Mar. 5, 2009

he Japanese are regarded as the true pioneers of market technical analysis. They began trading forward rice contracts (Futures) in 1654 and over the next three centuries have developed many sophisticated ways to analyze the markets. One Japanese method of charting is called “Candlestick” because the individual lines resemble candles. While candlestick charts use the