he Japanese are regarded as the true pioneers of market technical analysis. They began trading forward rice contracts (Futures) in 1654 and over the next three centuries have developed many sophisticated ways to analyze the markets.
One Japanese method of charting is called “Candlestick” because the individual lines resemble candles. While candlestick charts use the exact same data as traditional bar charts, (open, high, low, close) they can present a powerful picture of market activity to even an untrained eye.
When you see a black bar in a candlestick chart you know the sentiment is bearish, and when the bar is white it’s bullish. These patterns provide a very useful tool in predicting market changes and direction.
Read Also

Mazergroup’s Bob Mazer dies
Mazergroup’s Bob Mazer, who helped grow his family’s company into a string of farm equipment dealerships and the main dealer for New Holland machinery in Saskatchewan and Manitoba, died July 6 from cancer.
BASIC CONSTRUCTION OF A CANDLESTICK LINE
The daily line shows the open, high, low and close. The thick part or candle is called the “real body.” It highlights the range between the open and close. If the close is above the open then the body will be white. When the real body is black this simply means the close was below the open.
The lines above and below the real body represent the high and low ranges for the period and are called “shadows.”
A long black body illustrates a bearish period in the market with an opening near the day’s high and close near the day’s low.
A long white body is the opposite of a long black body and shows technical strength with an opening near the low and a close near the high in a wide range period.
HAMMERS
A hammer occurs at market bottoms and are bullish as they are said to be “hammering out a bottom.” The hammer represents a period in the market, where an intraday selloff is met with strong supportive buying returning prices back near the open. This occurred in the oat market on Feb. 18, 2009. The July 2009 futures contract opened at $1.93, the high of the day. Prices were hammered down to $1.7825 before rallying back and settling at $1.89 per bushel.
The difference between the opening and closing price is referred to as the body and the selloff to the low of the day resembles a long tail. In order for the hammer formation to be valid, it is important for the tail to be at least twice as long as the body. This pattern is also referred to as an umbrella line.
Referencing the chart, notice futures prices ranged between US$2.25 and US$2.45 through December and January. Do you remember the good old days when a futures price of US$2.45 in March 2002 gave you a net cash price of C$4/bushel and in March 2003 US$2.25 gave you C$3.50/ bushel in your jeans? So comparatively, why were cash oat prices so much lower in December and January?
Two reasons:
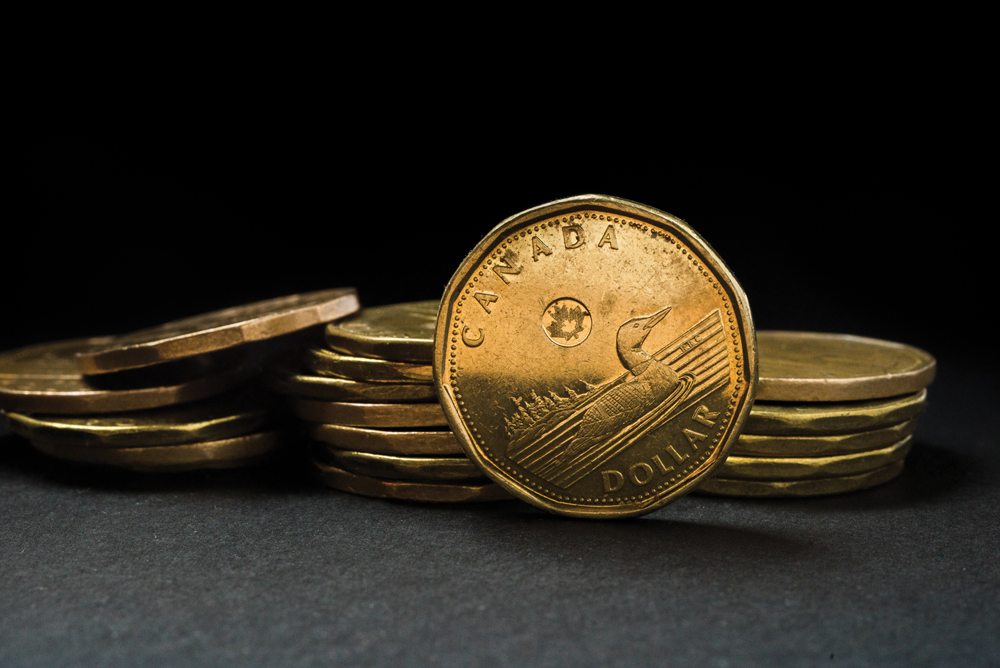
1) The Canadian dollar was worth 82 cents in December 2008 and January 2009, only 63 cents in March 2002, and 67 cents in March 2003.
2) The oat basis is so much poorer this year.
Oat basis levels have been anywhere from $45 to $85 per tonne wider than normal. Traditionally, $12 to $18 per tonne under the December futures contract or $19 to $25 per tonne under the March futures contract is what farmers were accustomed to receiving during harvest in eastern Manitoba until this year.
A wide or ugly basis is a market signal to lock the bin door until the basis improves and the futures market rallies. If the basis is costing you an additional $65/tonne ($1.00/ bushel) this year, and you had an average yield of 125 bu./ ac., it’s costing you an extra $125/acre to move your oats to market this year. How much storage could you build with an extra $125/acre in your pocket?
– David Drozd is president and senior market analyst for
Winnipeg-based Ag-Chieve Corporation. The opinions
expressed are those of the writer and are solely intended to assist
readers with a better understanding of technical analysis in the markets influencing agriculture. The information contained
herein is deemed to be from sources that are reliable, but its accuracy cannot be guaranteed. Visit us online at www.agchieve.ca/cooperator/formore educational tools and ideas about
grain marketing, or call toll free 1-888-274-3138.