
Canola has rallied $65 per tonne since Dec. 4, 2014, the day the May 2015 futures contract turned up from a second low at $408.60. A chart pattern known as a double bottom indicated the May futures contract would rally to $470 per tonne, a level not seen since June 30, 2014. Double bottom Double

Canola rallies to eight-month high
Market Outlook: Longs move back in when the market bottoms for a second time

Key reversal alerts livestock producers to recent downturn
Technical analysis has the ability to cut through the news and see opportunities
Live cattle futures plummeted $23 per hundredweight after turning down from a new historical high in late November 2014. As always, the news was incredibly bullish at the top, so some livestock producers may have been caught off guard by the sudden drop in prices. However, producers who study charting and technical analysis may have

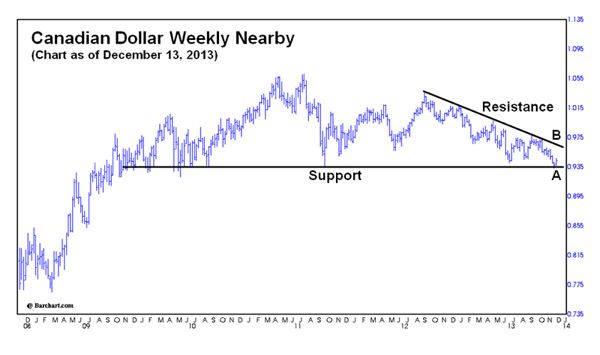
Canadian dollar continues to trend lower, slipping to a 5-1/2-year low
A lower Canadian dollar makes our exports more competitive but it increases the cost of imports
The Canadian dollar has been trending lower for the past three years. As recently as December 2012, it was trading at par to the U.S. dollar. Last year at this time it was worth 94 cents to the U.S. dollar and this year it is down to 86 cents. Canada is a resource-based country and

Drozd: Crude falls to four-year low, casts shadow across commodities
At the time of this writing, crude oil has plunged $40 per barrel, losing 37 per cent of its value, since prices turned down from $107.73 in June 2014. This market’s steady decline may have come as a surprise to some followers of oil, but for those who study charting and technical analysis, they were

Crude oil falls to a four-year low
Plunging prices are casting a dark shadow across the commodity sector
At the time of this writing, crude oil has plunged $40 per barrel, losing 37 per cent of its value, since prices turned down from $107.73 in June 2014. This market’s steady decline may have come as a surprise to some followers of oil, but for those who study charting and technical analysis, they were

Drozd: Classic head-and-shoulders top signals end to bull soybean market
The November 2014 soybean futures contract has lost over US$2 per bushel in the past two months. Once prices dropped below $12, a classic chart formation referred to as a head-and-shoulders top was completed and prices quickly plunged to the pattern’s minimum price objective of $11.31. The head-and-shoulders top is considered the most reliable chart
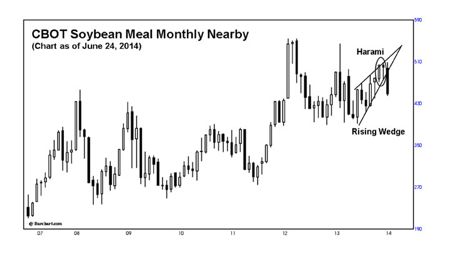
Drozd: Livestock producers look ahead to lower meal costs
To the relief of livestock producers, soybean meal prices have started to soften. At the end of May, a harami alerted producers to a downturn in the meal market. A harami is a reversal pattern often seen on a candlestick chart. This particular harami materialized at the height of the rally on the CBOT soybean

Drozd: Tweezer bottom signaled reversal in Nov. canola
Canola prices on the November 2014 futures contract lost nearly $100 per tonne before retracing a percentage of those losses. Four months after turning down from a high of $530 per tonne on Oct. 24, 2013, a tweezer bottom alerted savvy traders and farmers alike that the market was about to turn up. A tweezer
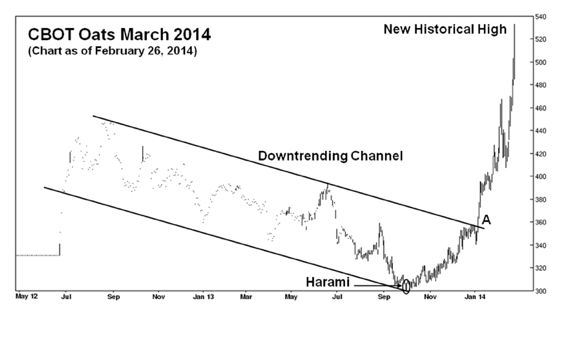
Drozd: Harami signaled market low before oats’ record-high rally
Nearby oat futures contract posted a new historical high of $5.33 per bushel on Feb. 26. This exceeded the previous high of $4.58 in July 2008. Referencing the March 2014 oat futures contract in Chicago, this rally began from a contract low of $3 per bushel on Oct. 2, 2013, the same day a harami
Drozd: Canadian dollar hits 3 1/2-year low as snowbirds head south
One year ago, the Canadian dollar was at par with the U.S. dollar. This year the loonie is only worth 94 cents to the U.S. dollar. Although the weak Canadian dollar makes vacationing in the southern U.S. more expensive, the lower Canadian dollar is supportive to Canadian grain prices. In reality, though, grain prices in