I received a few emails asking me to look into frost and the length of the frost-free season in more depth, so that is what we are going to start off with. Years and years ago, back when I was working on my thesis in geography at the University of Winnipeg, I did some research into the length of the frost-free season across agricultural Manitoba and parts of Saskatchewan. You can even do an Internet search and find an article I wrote with Dr. Danny Blair on the subject. Well, I definitely don’t have the time right now to do that kind of in-depth research, but I did dig a little deeper into this year’s numbers.
Read Also
Forecasting spring 2026 weather on the Prairies
What weather can farmers expect across Manitoba, Alberta and Saskatchewan as they head into seeding? Plus: a lesson on what makes the seasons turn
I looked back at the daily data for the major stations I typically use across all three Prairie provinces and recorded the dates for the last spring frost (LSF) and the first fall frost (FFF). Using these values, I then calculated the length of the frost-free season (FFS). The values I used for both the last spring frost and the first fall frost was 0.0 C or colder. I then compared these values with the 1981-2010 averages as provided by Environment Canada, which can be found on its website at climate.weather.gc.ca. I was hoping I would be able to do a quick look at the trends in the length of the frost-free season, as Environment Canada does provide climate normals for both the 1971-2000 and 1961-90periods. Unfortunately, these two datasets of climate normals did not contain the same frost data as the 1981-2010 dataset.
The table you see here shows the dates for the last spring frost (LSF), first fall frost (FFF), and the length of the frost-free season (FFS). I have also included the 1981-2010 averages. The final two columns give us a range of expected lengths for the frost-free season: the 90 per cent value means 90 per cent of the time, we should have an FFS no shorter than this; the 10 per cent value means 10 per cent of the time we could see an FFS that long.
Looking at the average data first, I always find it surprising just how close nearly all the stations are to each other across the Prairies. The difference between the shortest FFS and the longest is just 11 days, with Edmonton coming in at 110 days and Winnipeg at 121 days.
Let’s begin our look in Alberta, where both Calgary and Edmonton saw an FFS that was about five days longer than average. Farther north in the Peace River region, the FFS was about five days shorter. In Saskatchewan, Regina and Saskatoon both had a longer-than-average FFS by about five days. Finally, in Manitoba, the Brandon region had the shortest FFS at 123, but this was still above average by about four days. Dauphin saw an FFS of 126 days, a good 10 days longer than average. The Winnipeg region has had the longest FFS of all the major Prairie stations, with 132 days and still counting as of Sept. 26. This is 11 days longer than average, and with no significant chances of frost until sometime in the first week of October there is a chance that this region could see a less than one-in-10 frost-free season. Once things settle down in my world, I’ll take a look at the trends in the frost-free season across the three main stations in Manitoba.
Despite La Niña
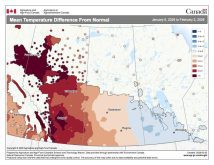
To finish off this week, the global temperature data for August came out last week and the results were a little surprising. Despite El Niño coming to an end and neutral-to-weak La Niña conditions (colder-than-average ocean temperatures across the tropical Pacific), global temperatures once again reached record levels. Most climate scientists were expecting a warmer-than-average month, but without the assistance of a warmer-than-average Pacific, many felt August would break the string of consecutive record-breaking months.
Both NOAA and NASA reported that globally, August 2016 was the warmest August ever recorded. NOAA reported global August temperatures that were 0.92 C above average, beating last year’s record by 0.05 C. This is the 16th consecutive month that NOAA has reported record-breaking monthly values. Meanwhile, NASA reported a value of 0.98 C above the 20th-century average. This is the 11th consecutive record-breaking month. Scientists now put the chance of 2016 being the warmest year on record at nearly 99 per cent. This would make 2016 the third consecutive hottest year on record. The long-term outlook for 2017 is leaning toward slightly cooler conditions globally, but like August, guess we’ll have to wait and see.