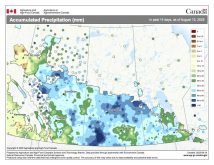
Before we start looking at snow cover maps, I thought we should take a look back at the total amount of precipitation
received across the Prairies over the last growing season compared to historical amounts. From the map
you can see that a huge portion of the agricultural Prairies saw extremely high moisture to record-wet conditions
during this period. Thinking back over the years I don’t remember the last time such a large area was this wet.
———
Read Also
Forecasting spring 2026 weather on the Prairies
What weather can farmers expect across Manitoba, Alberta and Saskatchewan as they head into seeding? Plus: a lesson on what makes the seasons turn
Copyright 2010 Agriculture &Agri-Food Canada
Precipitation Compared to Historical Distribution (Prairie Region)
April 1, 2010 to October 31, 2010
Prepared by Agriculture and Agri-Food Canada’s National Agroclimate Information Service (NAIS). Data provided through partnership with Environment Canada, Natural Resources Canada, and many Provincial agencies.
Record Dry
Extremely Low (0-10) Very Low (10-20) Low (20-40)
Mid-Range (40-60) High (60-80)
Very High (80-90)
Extremely High (90-100) Record Wet
Extent of Agricultural Land Lakes and Rivers
Produced using near real-time data that has undergone initial quality control. The map may not be accurate for all regions due to data availability and data errors.
Created: 11/01/10