The Weather Vane is prepared by Daniel Bezte, a teacher by profession with a BA (Hon.) in geography, specializing in climatology, from the University of Winnipeg. Daniel has taught university-level classes in climate and weather and currently operates a computerized weather station at his home near Birds Hill Park, on 10 acres he plans to develop into a vegetable and fruit hobby farm.
Contacthimwithyourquestionsandcommentsat [email protected].
Read Also

VIDEO: Here’s Manitoba’s 2026 spring storm forecast
Weather models are calling for above-average precipitation in southern Manitoba, with at least two more Alberta clippers possible.
———
Copyright 2011 Agriculture &Agri-Food Canada
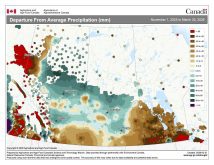
1 Month (30 Days) Percent of Average Precipitation (Prairie Region)
May 4, 2011 to June 2, 2011
Prepared by Agriculture and Agri-Food Canada’s National Agroclimate Information Service (NAIS). Data provided through partnership with Environment Canada, Natural Resources Canada, and many Provincial agencies.
< 40%
40 -60% 60 -85% 85 -115% 115 -150% 150 -200%
200% Extent of Agricultural Land Lakes and Rivers
Produced using near real-time data that has undergone initial quality control. The map may not be accurate for all regions due to data availability and data errors.
Created: 06/03/11
This issue’s map shows the amount of precipitation that has fallen across the Prairies during May compared
to the long-term average. From the map you can see that pretty much all of agricultural Manitoba saw aboveaverage
amounts of precipitation during this period with a large section seeing more than double the average.
Wet conditions were also present in southern Saskatchewan and Alberta with dry conditions continuing over
northern sections of those two provinces.