(Lightguard/E+/Getty Images)

You’re ready to roll for spring. Is your financial strategy?

SPRING Farmers face tighter margins as commodity prices plunge and input costs hold firm

Commodity prices are at least a third lower than last year and input prices are stubbornly high, so farmers will need a spring strategy to squeeze every dollar from every acre, experts warn. “There’s going to be pressure on the margins for pretty much most of the crops that we grow in Manitoba and across


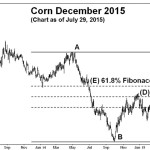
Drozd: Corn market plummets after rallying to a one-year high

Drozd: Corn market plummets after rallying to a one-year high

Faced with the realization that a weather market can end as quickly as it began, 
farmers have the daunting task of figuring out when to sell

It took the corn market three weeks to rally 75 cents per bushel and only two weeks to plummet just as far. When markets go down faster than they go up, farmers may have a difficult time taking advantage of a steep market rally like this. Farmers get busy and may not have got around

oats market graph

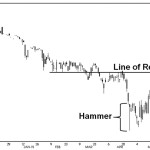
Drozd: Oat market hammers out a bottom

Bottoming action is evident in the December 2015 oat futures market

A hammer materialized on the December oat futures chart on Monday, April 27, 2015. Hammers are reversal patterns that appear at market bottoms on candlestick charts and are bullish, as they are said to be “hammering out a bottom.” The hammer represents a period in the market where an intraday sell-off is met with strong

soybean futures pricing chart

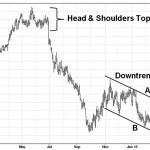
Drozd: Soybean market falls to a new low

The November futures contract is stuck in a downward trend

The soybean market has been under considerable pressure. The weakness started after a head-and-shoulders top developed on June 30, 2014. This classic reversal pattern was featured in my August 2014 column and I’ve also illustrated it in the accompanying chart. What a difference a year makes! The daily soybean futures contracts are trading at new


grain bins

Editorial: Captive grain, and captive farmers?

COFCO likley to create waves for the future of grain pricing

Those who follow livestock markets will know the term “captive cattle” — feedlot cattle owned by the large packers, and which they can use to maintain supply and/or take the pressure off rising open-market prices. In the past that’s led to some U.S. government intervention, such as mandatory reporting of purchases and prices. Recent developments

chart showing Canadian dollar value

Drozd: Harami alerts producers to impending rally in the Canadian dollar

A harami that occurs at the end of a significant move down in price and time 
will have more reliability than any other place on a chart

The Canadian dollar has rallied nearly 600 basis points in the past six weeks. This rally may have come as a surprise to some people, but not to those studying candlestick charting. The Japanese are regarded as the true pioneers of candlestick charting. The Japanese method of charting is called candlestick because the individual lines

canola trend price chart

Canola rallies to eight-month high

Market Outlook: Longs move back in when the market bottoms for a second time

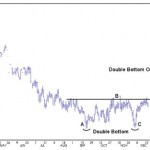
Canola has rallied $65 per tonne since Dec. 4, 2014, the day the May 2015 futures contract turned up from a second low at $408.60. A chart pattern known as a double bottom indicated the May futures contract would rally to $470 per tonne, a level not seen since June 30, 2014. Double bottom Double


Mike Jubinville

Canola prices entering sideways trend

The old highs have become the new lows

Canola prices are tracking the overall trend towards lower commodity prices this year, but there is still room for some comfortable margins, a prominent market analyst says. Speaking at Farm Credit Canada’s Ag Outlook 2015 in Winnipeg, Mike Jubinville of ProFarmer Canada said that while the canola markets aren’t good, they’re not really bad either.

Crude oil monthly nearby: Chart as of Nov. 27, 2014.

Crude oil falls to a four-year low

Plunging prices are casting a dark shadow across the commodity sector

At the time of this writing, crude oil has plunged $40 per barrel, losing 37 per cent of its value, since prices turned down from $107.73 in June 2014. This market’s steady decline may have come as a surprise to some followers of oil, but for those who study charting and technical analysis, they were