
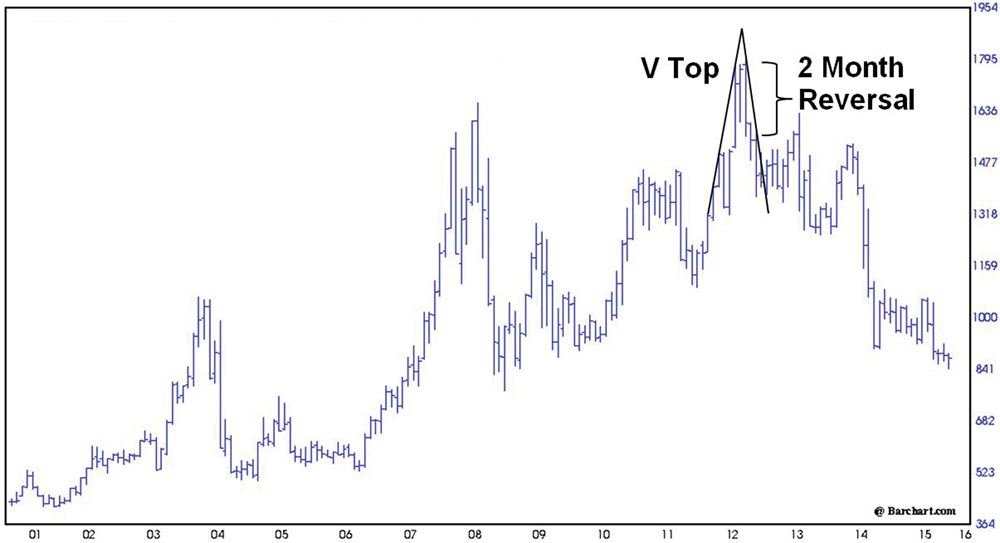
The soybean market has been under pressure since it topped out at the historical high of 17.945 on September 4, 2012. This was a pivotal day, as it marked the end of the bull market rally and the beginning of the ensuing bear market. Now down to $8.44, the soybean futures market has lost 53 per cent of its value.
When the market first turned down, it could have been construed as just another pullback, but a two-month reversal developed at the market high indicating a possible change in trend.
A two-month reversal is illustrated in the accompanying chart. It occurs when on the first month (at a top), the market advances to new highs and closes strong near the high of the month. The following month, prices open unchanged to slightly higher but quantity selling appears early in the month to halt the advance and prices begin to erode. By the end of the month, the market drops to around the preceding month’s low and closes at or near that level.
Read Also
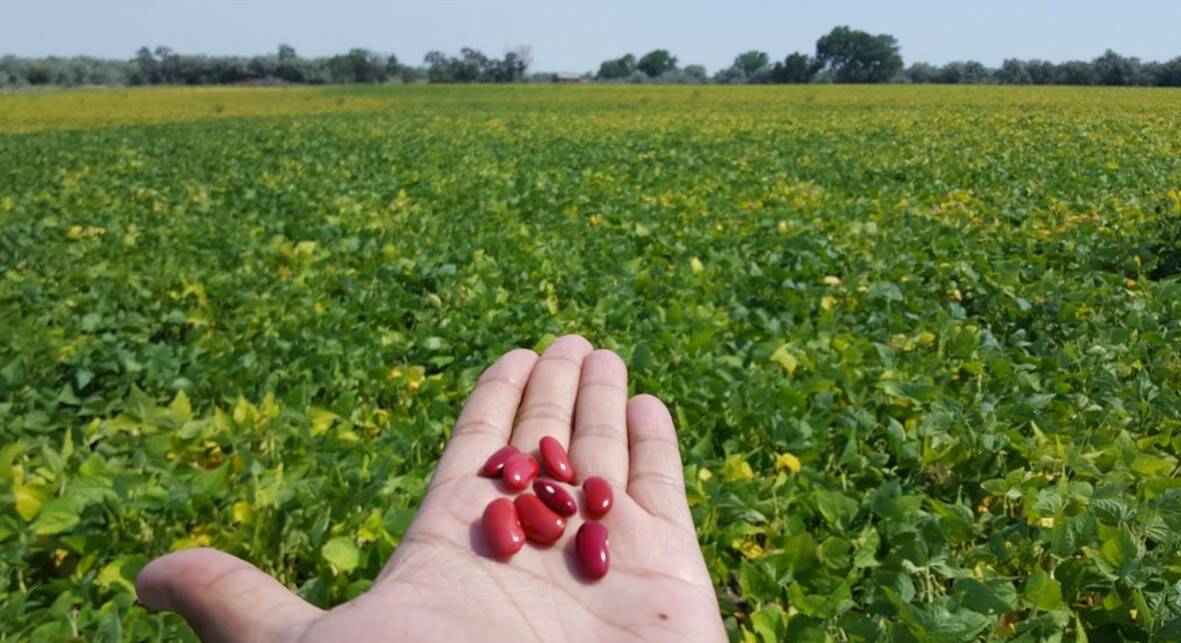
Dry bean breeding has paid off for farmers
Experts say they’ve seen the payoff in yield and farmer profit as better dry bean varieties have hit the scene in Manitoba and surrounding regions.
The two-month reversal indicates a sharp turn in sentiment. On the first month the longs are comfortable and confident. The market’s performance provides encouragement and reinforces the expectation of greater profits. The second month’s activity is a complete turnaround from the preceding month, which shakes the confidence of many who are still long the market. Longs respond to weakening prices by exiting (selling) the market.
The following month’s weakness provided further confirmation of a possible top, as it led to the development of a V Top formation.
V Top
To begin with, prices must be in an uptrend with the futures contract more apt to be in a near vertical rise. A pivot point is reached marking the extreme high price level wherein the buying pressure reaches a climax. This is followed by the sudden emergence of a downtrend.
An aid in recognizing this downtrend at an early stage is to compare the slope of prices during the incline to the slope of prices after the pivot. If the angle of decline is approximately equal to the angle of advance, the pattern is more likely to be valid. Dynamic and substantial price moves often follow V Top formations.
Market psychology
Since the market is likely to be in a vertical rise prior to the V turn, the longs are making money and the shorts are being wiped out. Suddenly, a dramatic shift in psychology drives the longs to cover (sell back) their positions as the motivation to preserve profits quickly takes hold. They find they have plenty of company, as potential new shorts also want in.
Without news to explain the sudden turn, longs may at first misjudge the turn as being merely a pullback. With profits on the books, they are going to wait and see what happens, which turns out to be a big mistake. The market is driven lower by aggressive new shorts and longs trying to make the best of a rapidly deteriorating position.
As a new downtrend begins to emerge, sell orders materialize but many are at a limit price above the market. Some of this selling is satisfied when prices rise, but a portion of the demand is not satisfied so when prices again begin to move down, some of these sellers jump in.
The balance of unfilled selling will continue to trail the market in hopes of catching a retracement. However, much of the patience of those waiting for a big rally will wear thin, resulting in more selling being thrown into the market at the prevailing price level.
The increasing willingness of sellers to short the market causes the lower highs and lower lows in a bear market, making it all the more difficult for grain producers to sell soybeans at the previous high.
Send your questions or comments about this article and chart to [email protected].