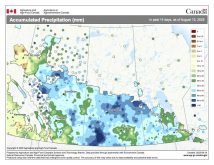
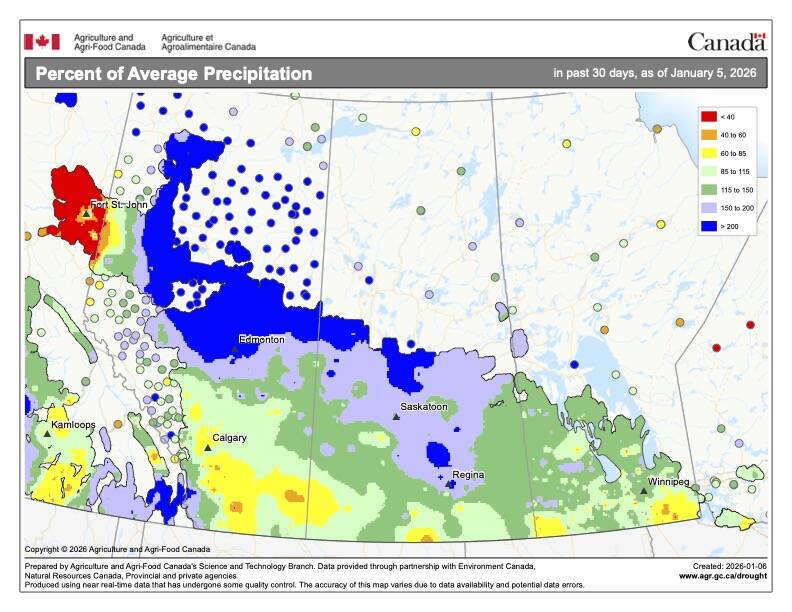
Before we start looking at snow cover maps, I thought we should take a look back at the total amount of precipitation
received across the Prairies over the last growing season compared to historical amounts. From the map
you can see that a huge portion of the agricultural Prairies saw extremely high moisture to record-wet conditions
during this period. Thinking back over the years I don’t remember the last time such a large area was this wet.
———
Read Also
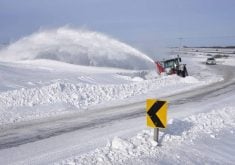
The lowdown on winter storms on the Prairies
It takes more than just a trough of low pressure to develop an Alberta Clipper or Colorado Low, which are the biggest winter storms in Manitoba. It also takes humidity, temperature changes and a host of other variables coming into play.
Copyright 2010 Agriculture &Agri-Food Canada
Precipitation Compared to Historical Distribution (Prairie Region)
April 1, 2010 to October 31, 2010
Prepared by Agriculture and Agri-Food Canada’s National Agroclimate Information Service (NAIS). Data provided through partnership with Environment Canada, Natural Resources Canada, and many Provincial agencies.
Record Dry
Extremely Low (0-10) Very Low (10-20) Low (20-40)
Mid-Range (40-60) High (60-80)
Very High (80-90)
Extremely High (90-100) Record Wet
Extent of Agricultural Land Lakes and Rivers
Produced using near real-time data that has undergone initial quality control. The map may not be accurate for all regions due to data availability and data errors.
Created: 11/01/10