As we pass the end of another calendar year, it is time to take a look back at the past year’s weather to see how everything added up. Before I zoom into Manitoba, let’s take a quick look at the global picture.
November’s global temperature numbers have just been released and three of the five main reporting agencies ranked November, 2019, as the second-warmest November in the 140 year data record. The warmest November occurred in 2015, which came in 0.09 C warmer than this November. Looking at the other two reporting agencies, Copernicus EU had this November tied with 2015 as the warmest month, and the University of Alabama — Huntsville reported this November as the warmest in its 42 years of record. Of note, is that six of the top 10 warmest November’s have all occurred in this decade.
Read Also

Thunderstorms and straight-line winds
Straight-line winds in thunderstorms can cause as much damage as a tornado and are next on our weather school list exploring how and why severe summer weather forms.
With December’s numbers still to come in, it is looking like 2019 will come in as the second-warmest year on record globally, coming in behind 2016. Even if December 2019 comes in much cooler than expected, 2019 will still be coming in either second or tied for second with 2015 and 2017. Statistically, NOAA has the odds of 2019 coming in as the second- or third-warmest year at 95 per cent and as one of the top five warmest years at greater than 99.9 per cent.
What makes this year’s global temperature values a little surprising is that there was no El Niño event taking place to help boost global temperatures, as often occurs during record-warm years.
Now on to our brief look at 2019 weather for Manitoba, starting off with an overview of the year, followed by a month-by-month view. For these numbers I took the three main reporting centres and averaged them out to create one provincial number.
2019
Average temperature: 1.3 C
Difference from average: -1.2
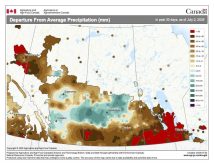
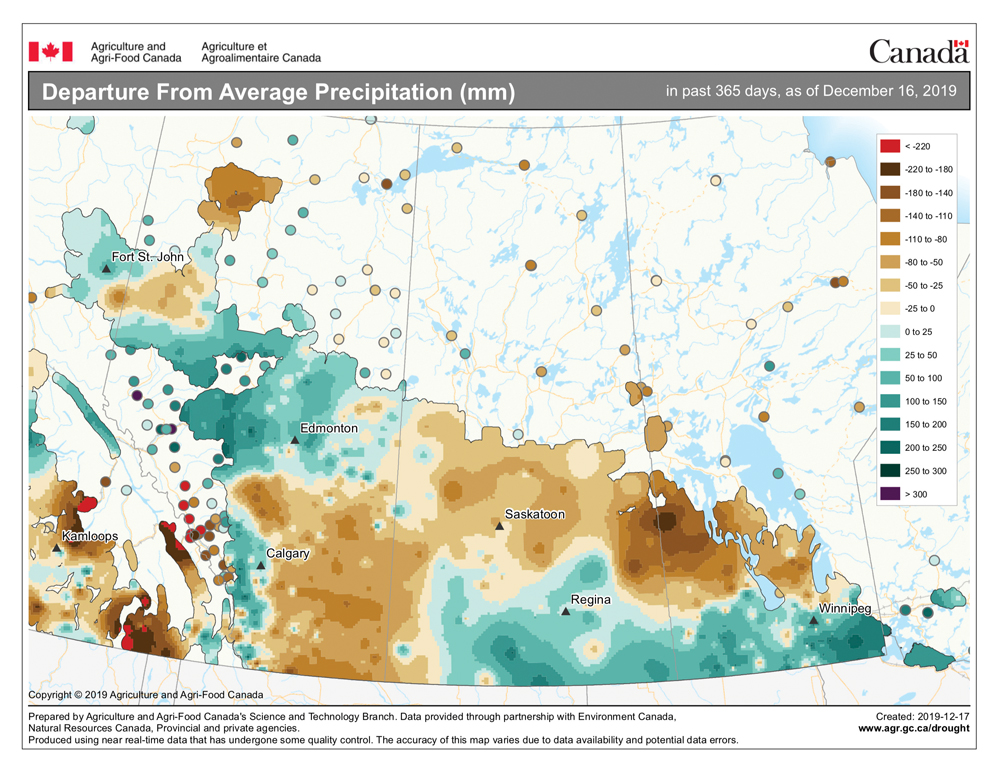
Average precipitation: 450.0 mm
Difference from average: -43.0 mm
Overall, it was a cooler-than-average year in Manitoba, but the value was skewed by a very cold February. If February was dropped out, then the year would have come in just a little below average.
January
Average temperature: -17.8 C
Difference from average: -1.6 C
Average precipitation: 11.0 mm
Difference from average: -6.0 mm
Cold and dry month.
February
Average temperature: -20.7 C
Difference from average: -7.5 C
Average precipitation: 17.0 mm
Difference from average: +4.0 mm
A near-record-cold month, with temperatures averaging a very cold 7 to 8° below average. It was also a snowy month, with slightly above-average amount of precipitation.
March
Average temperature: -7.5 C
Difference from average: -1.5 C
Average precipitation: 2.0 mm
Difference from average: -22.0 mm
Temperatures recovered a little bit in March, but were still well-below average. Luckily it was a very dry month, which meant low-snow amounts heading into April.
April
Average temperature: 4.2 C
Difference from average: +0.2 C
Average precipitation: 16.0 mm
Difference from average: -13.0 mm
The warming trend continued in April, with mean monthly temperatures rising to slightly above average. Precipitation remained below average.
May
Average temperature: 9.1 C
Difference from average: -1.8 C
Average precipitation: 27.0 mm
Difference from average: -30.0 mm
A bit of a cool-down in May, with temperatures coming in below average. Dry weather continued, with early-season drought conditions developing in some areas.
June
Average temperature: 16.7 C
Difference from average: +0.5 C
Average precipitation: 55.0 mm
Difference from average: -30.0 mm
June also saw near-average temperatures, but while the total amount of precipitation increased, amounts remained well-below average.
July
Average temperature: 19.3 C
Difference from average: +0.4 C
Average precipitation: 67.0 mm
Difference from average: -5.0 mm
A little warmer than average, with precipitation amounts coming in near to slightly below average. The extra rainfall helped to save some crops after the dry start to the season.
August
Average temperature: 17.5 C
Difference from average: -0.5 C
Average precipitation: 59.0 mm
Difference from average: -8.0 mm
Another slightly cooler-than-average month that also saw near- to slightly below-average amounts of precipitation.
September
Average temperature: 12.8 C
Difference from average: +0.7 C
Average precipitation: 145.0 mm
Difference from average: +93.0 mm
One of the few warmer-than-average months, but with the warmer weather came record amounts of rainfall. If the Dauphin region was dropped out of these numbers, then average rainfall was 170 mm, which was about 120 mm above average.
October
Average temperature: 2.6 C
Difference from average: -1.9 C
Average precipitation: 36.0 mm
Difference from average: +2.0 mm
Back to another cooler-than-average month along with near average for precipitation. South-central Manitoba saw well-above-average precipitation in October thanks to heavy wet snow that fell around the middle of the month.
November
Average temperature: -5.7 C
Difference from average: -0.4 C
Average precipitation: 13.0 mm
Difference from average: -9.0 mm
Temperatures continued to run a little below average, but thankfully the above-average precipitation of the last two months came to an end, with November seeing below-average amounts.
December (to the 16th)
Average temperature: -14.6 C
Difference from average: -1.2 C
Average precipitation: 3.0 mm
Difference from average: -16.0 mm
So far, December is running colder than average and as I write this, the two-week forecast is calling for near- to above-average temperatures, which should bump up the average temperature for the month. Precipitation is well-below average and looks to remain that way, with the two-week forecast not showing any significant snowstorms.
You may notice that this week’s Co-operator column is missing a forecast. Due to the holidays I had a much earlier deadline… and given that writing extended forecasts a week before they happen is already “cramping my stats” I figured you’d be just as accurate by throwing some darts at a weather map.
Well, that winds up our brief look at 2019, here’s looking ahead to a favourable 2020!