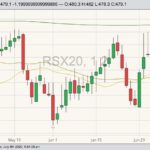
ICE May 2023 canola with 20-day moving average, RSI and CFTC Commitments of Traders data. (Barchart)

Reading between the lines: Oversold canola due for correction

Technical signs point to possible recovery

MarketsFarm — Canola futures posted sharp losses over the past week, with the May contract touching its weakest level in six months. While damage was done from a chart standpoint, there are technical signs that a recovery is possible. RSI The relative strength index (RSI) is a technical indicator that provides insight into whether a


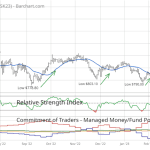
Canola testing chart support

CE Futures Canada canola contracts settled at their weakest levels in over a month on Oct. 29, and could be poised for further losses from a chart standpoint. The most active January contract settled at $471.20 per tonne on Oct. 29, which was below all of the major moving indicators and the weakest level for

Harami alerts hog producers to a downward correction

After rallying up, but failing to fill a gap between $91.475 and $91.650, lean hog prices on the weekly nearby candlestick chart turned back down on February 24, 2012. The ensuing reversal pattern (sell signal) that developed is referred to as a harami on a candlestick chart. Lean hog prices have since lost more than


Harami Warns Farmers Of An Impending Collapse In Oat Prices

David drozd The Japanese are true pioneers of technical analysis of the markets. You may remember last month’s column where I illustrated the weekly canola chart and identified the two-week reversal that materialized at the height of the rally in early January. Similarly, another reversal pattern known as a harami also developed at the end

Harami Warns Farmers Of Impending Drop In Wheat Prices

David drozd As I have mentioned before in this column, the Japanese are true pioneers of technical analysis of the markets. Their techniques have evolved from fairly simple beginnings, trading forward rice contracts (futures) in the 17th century, to now include many sophisticated ways to analyze the markets, including the amazingly powerful modern-day charting method