The Weather Vane is prepared by Daniel Bezte, a teacher by profession with a BA (Hon.) in geography, specializing in climatology, from the University of Winnipeg. Daniel has taught university-level classes in climate and weather and currently operates a computerized weather station at his home near Birds Hill Park, on 10 acres he plans to develop into a vegetable and fruit hobby farm.
Contacthimwithyourquestionsandcommentsat [email protected].
Read Also
Forecasting spring 2026 weather on the Prairies
What weather can farmers expect across Manitoba, Alberta and Saskatchewan as they head into seeding? Plus: a lesson on what makes the seasons turn
———
Copyright 2010 Agriculture &Agri-Food Canada
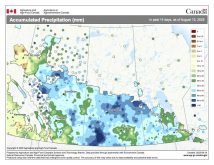
3 Month (90 Days) Accumulated Precipitation (Prairie Region)
May 22, 2010 to August 19, 2010
Prepared by Agriculture and Agri-Food Canada’s National Agroclimate Information Service (NAIS). Data provided through partnership with Environment Canada, Natural Resources Canada, and many Provincial agencies.
< 25 mm 25 -50 mm 50 -75 mm 75 -100 mm 100 -125 mm 125 -150 mm 150 -175 mm 175 -200 mm 200 -225 mm 225 -250 mm 250 -275 mm 275 -300 mm 300 -325 mm 325 -350 mm 350 -375 mm 375 -400 mm 400 -450 mm
450 mm
Extent of Agricultural Land Lakes and Rivers
Produced using near real-time data that has undergone initial quality control. The map may not be accurate for all regions due to data availability and data errors.
Created: 08/20/10
This issue’s map shows the total amount of precipitation that has fallen across the Prairies over the last
90 days.