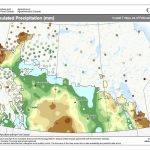
Accumulated Precipitation (Prairie Region)
April 1, 2009 to October 22, 2009
Prepared by Agriculture and Agri-Food Canada’s National Agroclimate Information Service (NAIS). Data provided through partnership with Environment Canada, Natural Resources Canada, and many Provincial agencies.
< 25 mm 25 -50 mm 50 -75 mm 75 -100 mm 100 -125 mm 125 -150 mm 150 -175 mm 175 -200 mm 200 -225 mm 225 -250 mm 250 -275 mm 275 -300 mm 300 -350 mm 350 -400 mm 400 -450 mm 450 -500 mm 500 -550 mm
550
Extent of Agricultural Land Lakes and Rivers
Produced using near real-time data that has undergone initial quality control. The map may not be accurate for all regions due to data availability and data errors.
Created: 10/23/09
This week’s map shows the total amount of precipitation that has fallen across the Prairies over the extended
growing season (April 1 Oct. 22). Manitoba and much of Saskatchewan saw decent rain during this period,
while Alberta continues to be dry.