The Weather Vane is prepared by Daniel Bezte, a teacher by profession with a BA (Hon.) in geography, specializing in climatology, from the University of Winnipeg. Daniel has taught university-level classes in climate and weather and currently operates a computerized weather station at his home near Birds Hill Park, on 10 acres he plans to develop into a vegetable and fruit hobby farm.
Contacthimwithyourquestionsandcommentsat [email protected].
Read Also
Prairie weather all starts with the sun
The sun’s radiation comes to us in many forms, some of which are harmful to organic life while others are completely harmless or even essential, Daniel Bezte writes.
———
Copyright 2011 Agriculture &Agri-Food Canada
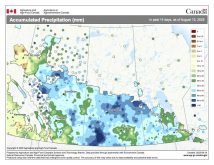
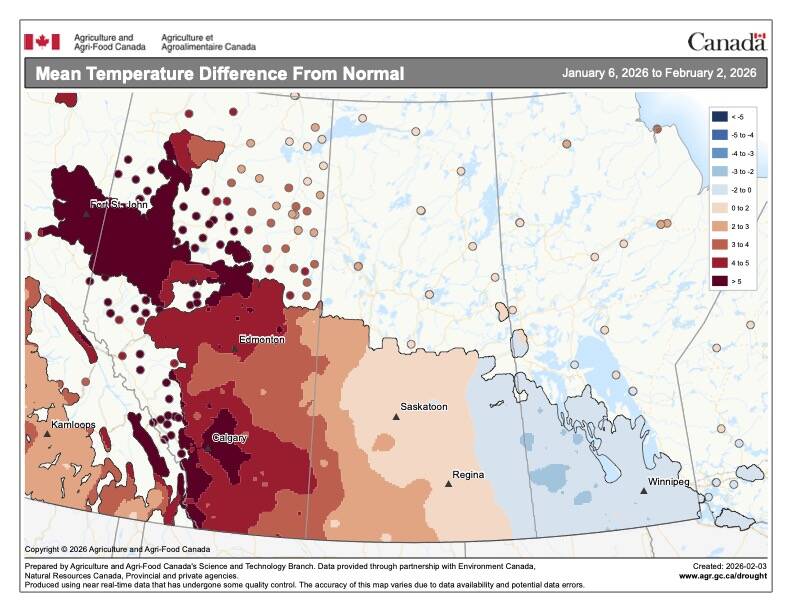
1 Month (30 Days) Accumulated Precipitation (Prairie Region)
March 2, 2011 to March 31, 2011
Prepared by Agriculture and Agri-Food Canada’s National Agroclimate Information Service (NAIS). Data provided through partnership with Environment Canada, Natural Resources Canada, and many Provincial agencies.
0 mm
0 -5 mm 5 -10 mm 10 -15 mm 15 -20 mm 20 -25 mm 25 -30 mm 30 -40 mm 40 -50 mm 50 -60 mm 60 -70 mm 70 -80 mm 80 -90 mm 90 -100 mm 100 -125 mm 125 -150 mm 150 -200 mm
200 mm
Extent of Agricultural Land Lakes and Rivers
Produced using near real-time data that has undergone initial quality control. The map may not be accurate for all regions due to data availability and data errors.
Created: 04/01/11
This issue’s map shows the total amount of precipitation that fell across the Prairies during the month
of March. From the map you can see that western and eastern regions saw some significant amounts of
precipitation during the month with some areas seeing upward of 40 millimetres. Most of Saskatchewan was
dry during March with a large area seeing fewer than five mm.