The Weather Vane is prepared by Daniel Bezte, a teacher by profession with a BA (Hon.) in geography, specializing in climatology, from the University of Winnipeg. Daniel has taught university-level classes in climate and weather and currently operates a computerized weather station at his home near Birds Hill Park, on 10 acres he plans to develop into a vegetable and fruit hobby farm.
Contacthimwithyourquestionsandcommentsat [email protected].
Read Also

Supply management schism still dividing agriculture
Bill C-202 wound up pitting farmer against farmer for political reasons at a time when an unwritten law of Canadian politics remains very much in effect anyway.
———
Copyright 2011 Agriculture &Agri-Food Canada
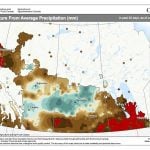
Precipitation Compared to Historical Distribution (Prairie Region)
April 1, 2011 to August 18, 2011
Prepared by Agriculture and Agri-Food Canada’s National Agroclimate Information Service (NAIS). Data provided through partnership with Environment Canada, Natural Resources Canada, and many Provincial agencies.
Record Dry
Extremely Low (0-10) Very Low (10-20) Low (20-40)
Mid-Range (40-60) High (60-80)
Very High (80-90)
Extremely High (90-100) Record Wet
Extent of Agricultural Land Lakes and Rivers
Produced using near real-time data that has undergone initial quality control. The map may not be accurate for all regions due to data availability and data errors.
Created: 08/19/11
This issue’s map shows the amount of precipitation that has fallen across the Prairies over the 60-day period
ending Aug. 18 compared to what we would historically expect. Areas that are dark green and blue have seen
much more rain than what would historically be expected, while those areas in yellow and browns have seen
much less. A good portion of the Prairies has seen historically wet conditions over the last 60 days, with only
small pockets seeing historically dry conditions.