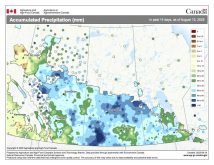
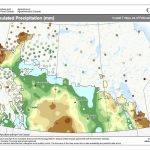
1 Month (30 Days) Departure from Average Precipitation (Prairie Region)
July 6, 2011 to August 4, 2011
Prepared by Agriculture and Agri-Food Canada’s National Agroclimate Information Service (NAIS). Data provided through partnership with Environment Canada, Natural Resources Canada, and many Provincial agencies.
The Weather Vane is prepared by Daniel Bezte, a teacher by profession with a BA (Hon.) in geography, specializing in climatology, from the University of Winnipeg. Daniel has taught university-level classes in climate and weather and currently operates a computerized weather station at his home near Birds Hill Park, on 10 acres he plans to develop into a vegetable and fruit hobby farm.
Read Also
How Earth evens out the energy input
Earth has surpluses of radiation in its equatorial regions, and deficits toward its poles. Our weather is a matter of Earth trying to even out the imbalance, Daniel Bezte writes.
Contacthimwithyourquestionsandcommentsat [email protected].
< -60 mm
-60 to -50 mm -50 to -40 mm -40 to -30 mm -30 to -20 mm -20 to -10 mm -10 to 0 mm 0 to 10 mm 10 to 20 mm 20 to 30 mm 30 to 40 mm 40 to 50 mm 50 to 60 mm
60 mm Extent of Agricultural Land Lakes and Rivers
Produced using near real-time data that has undergone initial quality control. The map may not be accurate for all regions due to data availability and data errors.
Created: 08/05/11
This issue’s map shows the departure from average precipitation amounts across the agricultural Prairies over the 30-day period ending Aug. 4. During this period, northern areas saw well-above-average amounts of rain with large areas seeing over 60 millimetres more than average. Over the south, conditions were drier, with the driest conditions being over southeastern Manitoba.