It’s been an interesting summer so far across the Prairies. After a very cold start to spring, summer moved in early, with temperatures across all three Prairie provinces soaring to well-above-average values in May.
The question then became whether we’d see the warm temperatures continue into summer or would we see a return of the cold weather that we saw in early spring? The answer to that was, yes… and no. A good portion of the Prairies have seen a general continuation of the warm/hot weather that they first saw in May, but for other areas, this summer has just been average.
Read Also
Why is the sky blue?
The colour of the skies, on the Prairies and elsewhere, tells the story of the paths sunlight takes as it enters Earth’s atmosphere, Daniel Bezte writes.
We will soon do a full in-depth look at summer temperatures across the Prairies, going back over the long-term records to see how this summer has stacked up so far against previous years. In this article, we’ll just wet our whistle by taking a fairly good look at how warm or cold temperatures have been across the Prairies this summer. We’ll wait for the August numbers to be in for the more detailed assessment. For those of you who like numbers and tables of data, you will love this article.
You would think that looking at temperature data is easy and straightforward, and it is, to a point. Sure, I can look at just the mean monthly temperatures, but that only gives you one piece of the temperature puzzle. To get a little better picture, our first table (Table 1 below) shows the average high and low temperatures for May, June, and July across the major reporting stations in Manitoba, Saskatchewan, and Alberta. All values are in degrees Celsius.
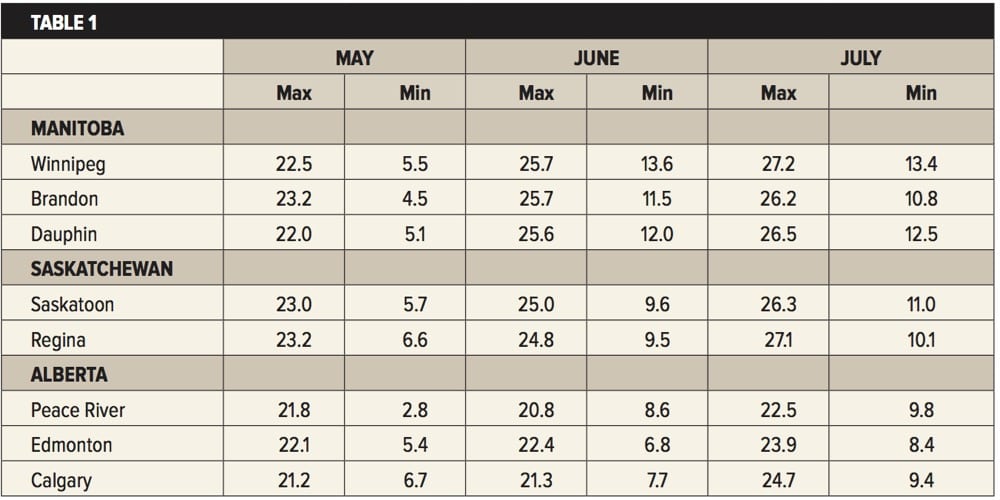
Looking at the data you can see that in May, temperatures were very similar across all three Prairie provinces. In June and July, both Manitoba and Saskatchewan had similar temperatures, while Alberta was a little cooler. While these numbers are interesting, to put them into perspective we need to compare them against their long-term averages. The next table (Table 2 below) shows the difference from average for the May to July period and the June to July period.
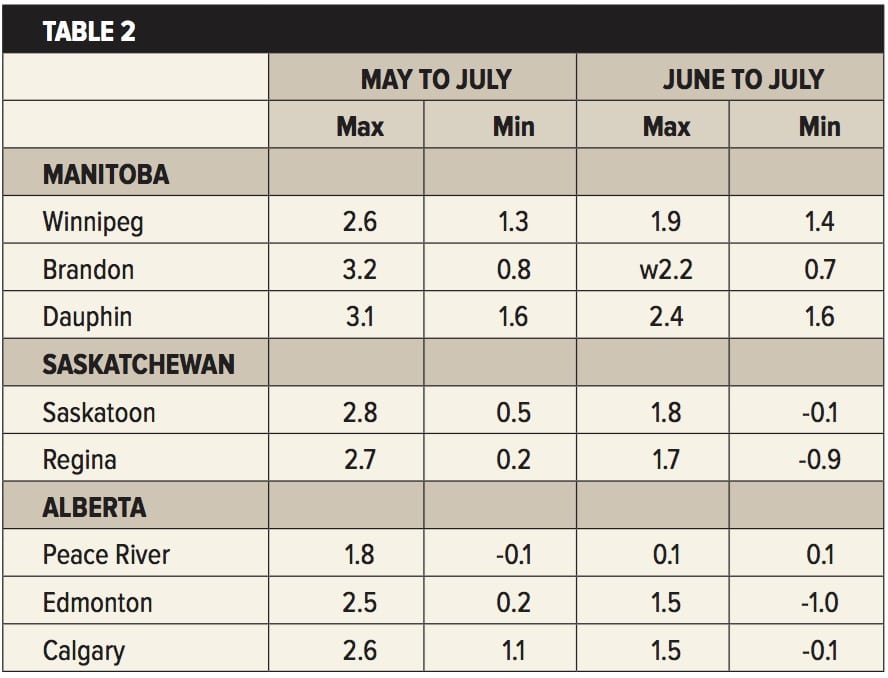
What I found interesting from the data is not the fact that daily maximums were above average, but that, with the exception of Manitoba, overnight lows were near or below average. This is interesting because the long-term climate trend has been for most of our warming to be occurring at night, and this is something that I have noted over the last several years. For some reason, this year, the heat is showing itself during the day. One explanation could be that drier areas and lower humidities allowed for more daytime heating and increased heat loss at night (drier air and lack of evening clouds). Problem is, not all areas have been dry.
If we look at the warmer-than-average daily maximums, one way to dig a little deeper is to see how many days we have seen above 30 C so far this year. The next table (Table 3 below) shows the monthly average number of 30+ C days for each station, along with the number we have seen this year and the difference from average.
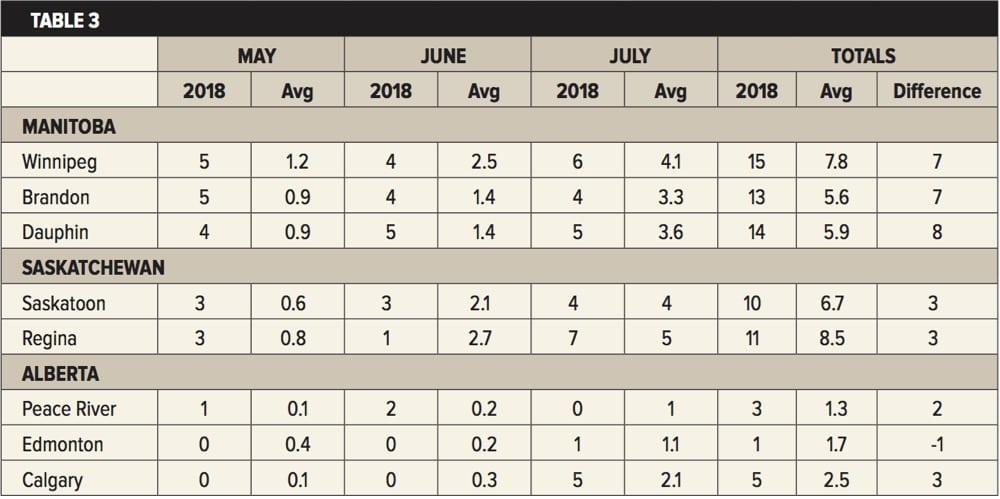
From this table we can see that Manitoba has seen more than double the usual 30+ C days so far this year. Both Saskatchewan and Alberta have seen a few more days than average, with only Edmonton seeing less than average. What also stands out is just how many more 30+ C days the eastern Prairies see on average compared to the western Prairies. Something that is not included in this table, that I found interesting, is that August typically experiences the most 30+ C days. So, if the trend towards above-average 30+ C days continues, daily maximum temperatures will continue to run above average.
We’ll re-examine this data at the end of August and at that time I’ll include a look back at previous summers to see how the summer of 2018 stacked up.