I have had several questions about the dry weather and there have been several small articles in the news discussing the drought we are currently experiencing. So, for this article I figured we should explore the topic of droughts and do just a little bit of digging into just how bad this current drought really is.
I find it interesting that, as I sit here writing about our drought, the weather forecast is calling for upward of 25 to 50 mm of rain, but as you will see, that amount of rain is literally a drop in the bucket compared to just how big a precipitation deficit some regions have accumulated over the last 10 years.
Read Also

Canadian canola prices hinge on rain forecast
Canola markets took a good hit during the week ending July 11, 2025, on the thought that the Canadian crop will yield well despite dry weather.
To begin, just what defines a drought? After looking around the internet and through various textbooks I found this short explanation from the U.S. National Weather Service did the best job explaining it. A drought is defined as “a period of abnormally dry weather sufficiently prolonged for the lack of water to cause serious hydrologic imbalance in the affected area.” (Glossary of Meteorology, 1959). In easier-to-understand terms, a drought is a period of unusually persistent dry weather that persists long enough to cause serious problems, such as crop damage and/or water supply shortages. The severity of the drought depends upon the degree of moisture deficiency, the duration, and the size of the affected area.
There are four different ways that drought can be defined.
- Meteorological: a measure of departure of precipitation from normal. Due to climatic differences, what might be considered a drought in one location of the country may not be a drought in another location.
- Agricultural: a situation where the amount of moisture in the soil no longer meets the needs of a particular crop.
- Hydrological: when surface and subsurface water supplies are below normal.
- Socio-economic: when physical water shortages begin to affect people.
If we look at the current situation across Manitoba and Western Canada, the conditions over many regions hit all four definitions of a drought.
The question that has been asked of me the most is, just how long has the drought been going on? This is a tougher question than it seems at first glance. Just looking at precipitation data does not necessarily paint a clear picture. You can have below-average precipitation, but the timing of precipitation during the year, the form of the precipitation and temperatures all impact whether the meteorological drought becomes an agricultural, hydrological or socio-economic drought.
It also takes a lot of time to dig into the weather data, especially when the data has issues. Typically, when I want to do a quick check on longer-term weather events such as droughts, I like to use Winnipeg’s dataset, as the data goes all the way back to 1872 and is typically of good quality. Now, I am not sure what happened with Environment Canada back in 2007, but chunks of data from that year were missing. This jogged my memory about a blog posting I came across earlier this year, which I couldn’t find again, that was written by someone studying weather at a university in Western Canada. It discussed the idea that the instruments and methodology used to capture precipitation data are flawed and precipitation amounts from Environment Canada are often lower than what occurred.
Running totals
To check this, what I did was compare Environment Canada’s yearly precipitation data with my own data. Now, due to the nature of precipitation there should be some differences, but as I am close to Winnipeg, overall, they should not be that big in the long term. What I found was, more often than not, Environment Canada reported less precipitation than my station. I know my data is pretty good as I often double-check my automated data with a manual rain gauge and any problems are usually quickly fixed. So for this quick study I used my own precipitation data.
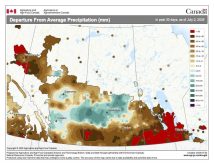
Going back to 1999 I recorded my yearly total precipitation, then created a running total of the total amount of precipitation. I then compared this to the running total if each year received the average amount of precipitation. This created a value that was either a positive number (surplus) or a negative number (deficit). I then plotted these values and included them in this issue’s weather graphic above. Looking at the graph, the red line represents the average amount of precipitation based on Environment Canada’s average precipitation data from 1981 to 2010, while the blue line represents how much of a surplus or deficit (anomaly) has been accumulating since 1999. You can see that between 1999 and 2010, precipitation amounts were close to average, a little above a couple of times and a little bit below for other periods — nothing that would mean drought conditions.
Starting in 2010, precipitation deficits started to accumulate, with a small recharge occurring between 2013 and 2016. After that it seems like the bottom fell out, with yearly deficits building on each other to the point that this region now has a 10-year precipitation deficit of over 1,000 mm or one metre.
So, how long has the drought been ongoing? About 10 years, and it is going to take more than a couple of storm systems to make up over one metre of rainfall, which is almost two years’ worth of precipitation. I will continue to look at this issue going forward, adding other regions as we go.

For more content related to drought management visit The Dry Times, where you can find a collection of stories from our family of publications as well as links to external resources to support your decisions through these difficult times.