MarketsFarm — Canadian canola stocks were slightly tighter at the end of the 2019 calendar year compared to the previous year, according to updated Statistics Canada data.
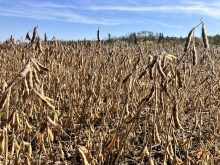
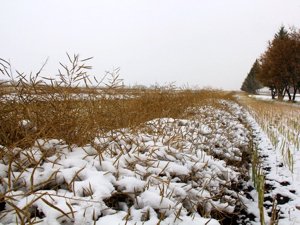
However, adverse harvest conditions left a large amount of the crop unaccounted for in the survey, which skews the overall supply/demand outlook.
“Because of poor weather conditions during harvest, a substantial amount of crops likely remained unharvested at the time of the survey,” StatsCan said while reporting the data.
“Farmers were asked to include only crops harvested and currently in storage when reporting stocks of principal field crops. Crops harvested after the collection period for the December survey will be included in later surveys.”
Read Also

Speculative net long position grows in canola
Speculative fund traders have added to their recently established net long position in canola, according to the latest Commitments of Traders report from the United States Commodity Futures Trading Commission (CFTC) released Friday, Feb. 27.
Using that criteria, canola stocks as of Dec. 31, 2019, were pegged at 14.3 million tonnes. That would be down 2.4 per cent from the previous year, but still 5.1 per cent above the five-year (2014-18) average.
However, industry participants estimate that one million to two million tonnes of canola were left to overwinter and be harvested in the spring.
“We just don’t know what’s out there,” MarketsFarm Pro analyst Mike Jubinville said, adding that the uncertainty makes it impossible to use the StatsCan stocks numbers to determine usage trends for many crops.
Total wheat stocks, as of Dec. 31, were estimated at 25 million tonnes, which would be down slightly from the previous year but a million tonnes above the five-year average.
Corn stocks, at 10.7 million tonnes, were down by nearly a million from the previous year. Reported soybean stocks were also down on the year, at 3.9 million tonnes.
While the complete supply picture won’t be fully known until subsequent reports after the spring harvest, Jubinville noted that pulse crops were harvested earlier and were likely all included in the latest data.
Lentil supplies of 1.8 million tonnes were down by about 300,000 tonnes on the year, while the 2.6 million tonnes of peas were up by nearly 100,000 tonnes.
Table: A recap of Statistics Canada’s stocks report for the period ended Dec. 31, 2019. Figures are in millions of metric tonnes.
| Total stocks, | Total stocks, | Five-year avg. | |
| Dec. 31, 2019. . | Dec. 31, 2018. . | (2014-18) | |
| Barley | 5.959 | 4.943 | 5.711 |
| Canola | 14.271 | 14.618 | 13.601 |
| Flaxseed | 0.380 | 0.410 | 0.573 |
| Oats | 2.671 | 2.406 | 2.574 |
| All wheat. . | 24.982 | 25.109 | 24.000 |
| Durum | 4.516 | 5.478 | 4.934 |
| Lentils | 1.801 | 2.116 | 1.757 |
| Peas | 2.632 | 2.550 | 2.547 |
| Soybeans | 3.874 | 4.277 | 3.775 |
| Corn | 10.686 | 11.628 | 11.345 |