Glacier FarmMedia | MarketsFarm — Canadian canola and pea ending stocks may end up considerably larger at the close of the 2025/26 marketing year than originally thought if recently-imposed Chinese tariffs remain in place through the marketing year, said Agriculture and Agri-Food Canada in its latest supply/demand estimates released March 21.
Noting that “geopolitical risks and trade uncertainties have heightened volatility in both Canadian and international grain markets,” AAFC said its forecasts were based off the current trade policies and could easily be altered in subsequent reports.
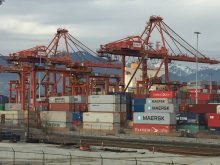
China imposed 100 per cent tariffs on Canadian canola oil, meal, and peas beginning March 20, while the U.S. has set April 2 as its next tariff date.
Read Also
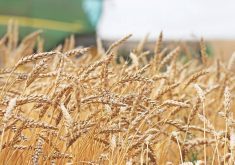
More canola, spring wheat likely to be seeded this spring
As spring planting approaches, farmers are busy planning which crops to seed this year and how much. With that, market thoughts have turned toward planted area projections, as Statistics Canada is set to issue its report on Thursday.
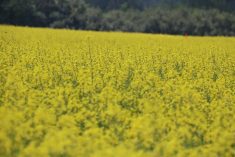
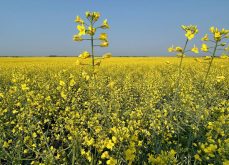
AAFC raised its call for 2025/26 canola ending stocks to 2.000 million tonnes, which compares with the February estimate of 1.000 million tonnes and the 2024/25 projection of 1.300 million tonnes.
While anticipated canola exports were revised slightly higher from the February forecast, they would still be down by 1.500 million tonnes on the year at 6.000 million. Meanwhile, projected domestic canola usage for 2025/26 was forecast at 11.400 million tonnes — down by a million tonnes from the February forecast.
“The reduced (domestic usage) forecast is tentative and may decline further if proposed tariffs and trade disturbances materialize,” said AAFC adding “the crush forecast may revert to last month’s estimates if policies stabilize, and plants operate at full capacity.
Meanwhile, AAFC expects Canadian pea exports will fall sharply from the current crop year with the expectation that current Chinese import tariffs continue and the non-import dry pea tariff exemption from India expires on May 31, 2025. Carry-out pea stocks are expected to rise to the record level of 1.775 million tonnes, from 700,000 for 2024/25.
March estimates for Canadian major crops supply and demand: in million tonnes. Source: Agriculture and Agri-Food Canada.
| Grains and oilseeds | |||||||
| Production | Exports | ||||||
| 2025/26 | 2025/26 | 2024/25 | 2025/26 | 2025/26 | 2024/25 | ||
| March | Feb | March | Feb | ||||
| All wheat | 34.489 | 35.195 | 34.958 | 25.300 | 26.050 | 26.150 | |
| Durum | 5.431 | 5.322 | 5.870 | 4.600 | 4.550 | 4.900 | |
| Barley | 8.080 | 8.600 | 8.144 | 2.800 | 2.900 | 2.930 | |
| Corn | 15.107 | 15.100 | 15.345 | 2.100 | 2.100 | 2.300 | |
| Oats | 3.380 | 3.510 | 3.358 | 2.320 | 2.320 | 2.320 | |
| Canola | 18.000 | 17.500 | 17.845 | 6.000 | 5.500 | 7.500 | |
| Flaxseed | 0.230 | 0.260 | 0.258 | 0.200 | 0.200 | 0.250 | |
| Soybeans | 7.250 | 6.900 | 7.568 | 5.250 | 4.950 | 5.500 | |
| TOTAL | 87.273 | 87.850 | 88.048 | 44.155 | 44.205 | 47.106 | |
| Domestic Usage | Ending Stocks | ||||||
| 2025/26 | 2025/26 | 2024/25 | 2025/26 | 2025/26 | 2024/25 | ||
| March | Feb | March | Feb | ||||
| All wheat | 9.114 | 9.170 | 9.113 | 4.600 | 4.500 | 4.400 | |
| Durum | 0.856 | 0.897 | 0.802 | 0.600 | 0.500 | 0.600 | |
| Barley | 5.565 | 5.750 | 5.680 | 0.600 | 0.750 | 0.785 | |
| Corn | 15.107 | 15.100 | 15.141 | 2.000 | 2.000 | 2.000 | |
| Oats | 1.080 | 1.110 | 1.100 | 0.400 | 0.500 | 0.400 | |
| Canola | 11.400 | 12.400 | 11.942 | 2.000 | 1.000 | 1.300 | |
| Flaxseed | 0.090 | 0.090 | 0.092 | 0.040 | 0.070 | 0.090 | |
| Soybeans | 2.450 | 2.450 | 2.465 | 0.575 | 0.525 | 0.575 | |
| TOTAL | 45.270 | 46.581 | 45.934 | 10.415 | 9.545 | 9.660 | |
| Pulse and Special Crops | |||||||
| Production | Exports | ||||||
| 2025/26 | 2025/26 | 2024/25 | 2025/26 | 2025/26 | 2024/25 | ||
| March | Feb | March | Feb | ||||
| Dry peas | 3.125 | 3.050 | 2.997 | 1.300 | 2.400 | 2.100 | |
| Lentils | 2.325 | 2.385 | 2.431 | 2.100 | 2.200 | 2.100 | |
| Dry beans | 0.370 | 0.385 | 0.424 | 0.380 | 0.390 | 0.400 | |
| Chickpeas | 0.265 | 0.245 | 0.287 | 0.175 | 0.175 | 0.165 | |
| Mustard | 0.085 | 0.130 | 0.192 | 0.095 | 0.100 | 0.095 | |
| Canaryseed | 0.125 | 0.140 | 0.185 | 0.120 | 0.125 | 0.120 | |
| Sunflower | 0.051 | 0.075 | 0.051 | 0.030 | 0.035 | 0.030 | |
| TOTAL | 6.346 | 6.410 | 6.568 | 4.200 | 5.425 | 5.010 | |
| Domestic Usage | Ending Stocks | ||||||
| 2025/26 | 2025/26 | 2024/25 | 2025/26 | 2025/26 | 2024/25 | ||
| March | Feb | March | Feb | ||||
| Dry peas | 0.770 | 0.660 | 0.537 | 1.775 | 0.475 | 0.700 | |
| Lentils | 0.265 | 0.265 | 0.266 | 0.375 | 0.335 | 0.340 | |
| Dry beans | 0.060 | 0.060 | 0.059 | 0.055 | 0.060 | 0.055 | |
| Chickpeas | 0.085 | 0.085 | 0.081 | 0.155 | 0.135 | 0.110 | |
| Mustard | 0.039 | 0.039 | 0.040 | 0.115 | 0.155 | 0.155 | |
| Canaryseed | 0.015 | 0.015 | 0.019 | 0.080 | 0.090 | 0.090 | |
| Sunflower | 0.066 | 0.065 | 0.066 | 0.135 | 0.155 | 0.155 | |
| TOTAL | 1.300 | 1.174 | 1.068 | 2.690 | 1.335 | 1.605 | |