The Weather Vane is prepared by Daniel Bezte, a teacher by profession with a BA (Hon.) in geography, specializing in climatology, from the University of Winnipeg. Daniel has taught university-level classes in climate and weather and currently operates a computerized weather station at his home near Birds Hill Park, on 10 acres he plans to develop into a vegetable and fruit hobby farm.
Contacthimwithyourquestionsandcommentsat [email protected].
Read Also
Forecasting spring 2026 weather on the Prairies
What weather can farmers expect across Manitoba, Alberta and Saskatchewan as they head into seeding? Plus: a lesson on what makes the seasons turn
———
Copyright 2011 Agriculture &Agri-Food Canada
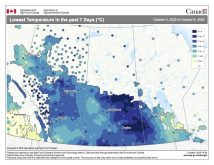
1 Month (30 Days) Percent of Average Precipitation (Prairie Region)
June 15, 2011 to July 14, 2011
Prepared by Agriculture and Agri-Food Canada’s National Agroclimate Information Service (NAIS). Data provided through partnership with Environment Canada, Natural Resources Canada, and many Provincial agencies.
< 40%
40 -60% 60 -85% 85 -115% 115 -150% 150 -200%
200% Extent of Agricultural Land Lakes and Rivers
Produced using near real-time data that has undergone initial quality control. The map may not be accurate for all regions due to data availability and data errors.
Created: 07/15/11
This issue’s map shows the total amount of precipitation that has fallen across the Prairies from the middle
of June through to the middle of July compared to long-term averages. The hot, dry weather we have seen
across much of agricultural Manitoba over the last couple of weeks is evident on the map with a good portion
of our region seeing less-than-average amounts of rain and some areas are becoming very dry. Farther west
much of Saskatchewan and Alberta continue to be wet.