The Weather Vane is prepared by Daniel Bezte, a teacher by profession with a BA (Hon.) in geography, specializing in climatology, from the University of Winnipeg. Daniel has taught university-level classes in climate and weather and currently operates a computerized weather station at his home near Birds Hill Park, on 10 acres he plans to develop into a vegetable and fruit hobby farm.
Contacthimwithyourquestionsandcommentsat [email protected].
Read Also

Prairie weather all starts with the sun
The sun’s radiation comes to us in many forms, some of which are harmful to organic life while others are completely harmless or even essential, Daniel Bezte writes.
———
Copyright 2011 Agriculture &Agri-Food Canada
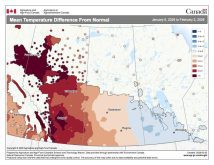
1 Month (30 Days) Percent of Average Precipitation (Prairie Region)
March 15, 2011 to April 13, 2011
Prepared by Agriculture and Agri-Food Canada’s National Agroclimate Information Service (NAIS). Data provided through partnership with Environment Canada, Natural Resources Canada, and many Provincial agencies.
< 40%
40 -60% 60 -85% 85 -115% 115 -150% 150 -200%
200% Extent of Agricultural Land Lakes and Rivers
Produced using near real-time data that has undergone initial quality control. The map may not be accurate for all regions due to data availability and data errors.
Created: 04/14/11
This issue’s map shows the amount of precipitation that has fallen across the Prairies over the last 30 days
compared to long-term averages. Looking at the map you can see that the north-central parts of the Prairies
have seen very little precipitation during this period while western and southern areas are near or above
average.