Manitoba farmers wrapping up harvest should take a hard look at their soil test results before making fertilizer decisions for the next growing season, according to a provincial soil specialist.
Sampling every year is the best way to avoid wasting money on unnecessary fertilizer, said Marla Riekman.
“We recognize that because some of these nutrients can change very quickly or change a lot from year to year, we recommend annual sampling,” she said during an Oct. 1 Crop Talk webinar hosted by the province. “Things like nitrogen and sulfur are mobile in the soil. They move with water, and so they can kind of come and go a little bit within that plant or within that rooting depth, that top two feet.”
Read Also
VIDEO: What climate change data gets wrong about the Prairies
Precipitation, not temperature, may be a better gauge of climate change impact on the Prairies, says director of the Prairie Adaptation Research Collaborative.
WHY IT MATTERS: Crop fertility and soil management experts commonly urge all farmers to test soil for the sake of tailored crop nutrition, cutting excess cost, sustainably improving yields and, in general, making more informed decisions when managing fields.
“If it’s nitrogen, let’s say we’ve followed a drier year, [and] we haven’t used as much of the nitrogen fertilizer that we have put down, we may have more available there for the next year,” Reikman said.
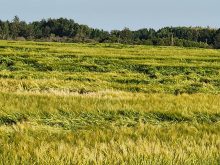
Manitoba farmers got an example of that following the drought of 2021, when yields dipped across crop species. According to Manitoba Agriculture Statistics, canola yield that year averaged 36.8 bushels an acre, compared to over 43 bu./ac. the following two years (last year’s yield was less impressive, at 37.1 bu./ac.). Wheat hit only 47.9 bu./ac., compared to 62.8 last year, and soybeans in 2021 dropped to 29.2 bu./ac., compared to yields that have wavered between 36.2 and 44 over the following three years.
The mobile nature of some nutrients adds complexity to fall soil sampling, with a winter and spring melt still standing between that field and the following crop.
In an interview with the Co-operator last year, Canola Council of Canada experts noted the pros and cons of different sample timing. Fall sampling offers more time for farmers to make decisions on fertilizer purchases, and allows them to take advantage of those often cheaper input prices. Spring, however, gives insight into nutrient levels directly before seeding, after any impacts from winter and snowmelt have run their course.
In a recent column published by Grainews, retired agrologist and agronomy researcher Ross McKenzie noted the tradeoff between more accurate sample results and the time crunch that spring sampling puts on fertilizer plans and soil test result analysis.
“So, if soils are moist, late fall — after soil temperature has dropped to five to seven degrees Celsius — is often the most practical time. If soils are very dry, sampling in early fall is fine,” he said.
More is more
Much of the messaging given to farmers in recent years has pushed the idea of ‘more’: more soil tests, more samples and from more places in the field.
McKenzie similarly pushed producers not to skimp on their sample methodology. Different types of fields will need different approaches to capture a representative sample, he noted. Random sampling may work for a relatively flat and uniform field, but rolling fields or shifting soil traits would do well to sample by management zone as determined by crop imaging, topographic maps and the farmer’s own observations about how things tend to grow in that field.
Whatever the approach, he advised at least 20 sites in the field be included.
“A common mistake is only taking six or seven soil cores from a field or management zone, which is not enough and may result in unreliable information for your fields and the development of inaccurate fertilizer recommendations,” McKenzie warned.
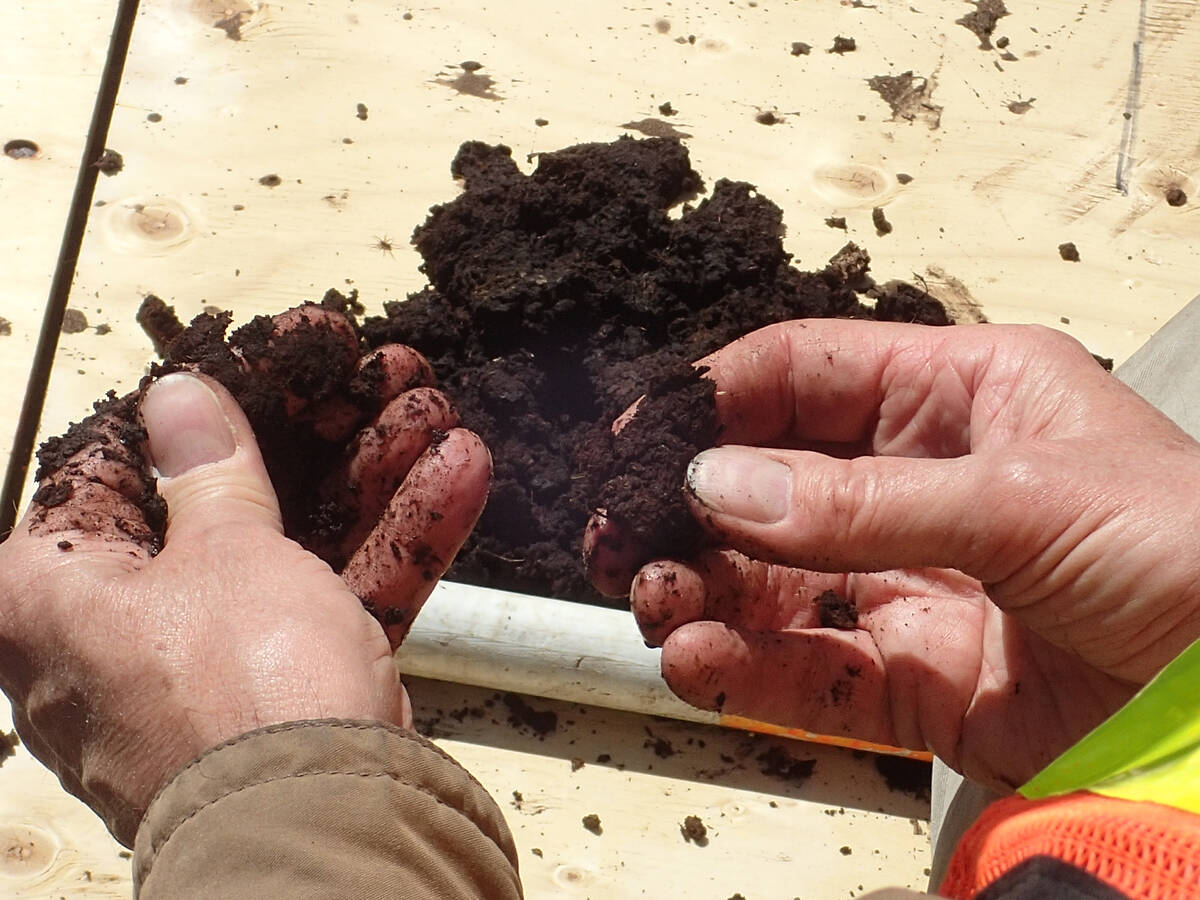
Riekman, meanwhile, advises 15 to 20 samples per field or zone to account for variability, even in flat Red River clay. Sample depth is critical: zero to six inches for phosphorus, potassium and micronutrients that stay near the surface, but down to 24 inches for nitrogen and sulfur that move with water.
“If you’re only soil sampling to the top six inches for things like nitrogen and sulfur, you can grossly underestimate how much nutrient is actually there,” Riekman said.
McKenzie advises even more thorough depth increments to better capture where nutrients are sitting in the soil. He urged producers to divide soil cores into the first six inches, a six-to-12-inch mid-depth increment, and a 12-to-24-inch deep sample.
For farms who don’t feel they can justify annual testing, tracking yields and removal rates helps budget nutrients between tests, but mobile nutrients like nitrogen and sulfur remain harder to predict without regular sampling, Riekman said.
Test result translation
When getting word back on nitrogen, the math is straightforward, Riekman noted. Labs report nitrate levels in pounds per acre down to two feet, and recommendations follow a predictable yield curve. Take the crop’s total nitrogen requirement, subtract what the soil test shows, and you have your fertilizer need.
Phosphorus works differently. It’s all about probabilities, not certainties.
Riekman put a test result of 10-20 parts per million as the sweet spot for phosphorus management. Below 10 parts per million, phosphorus levels could be built up. Above 20 ppm, levels could be drawn down without hurting yields.
“When you’re in this kind of 11 to 20, like, 10 to 20 ppm of Olsen test phosphorus in the soil, you have about a 50-50 chance of responding by adding more phosphorus fertilizer,” Riekman said.
That range gives farmers flexibility when fertilizer prices spike, she noted.
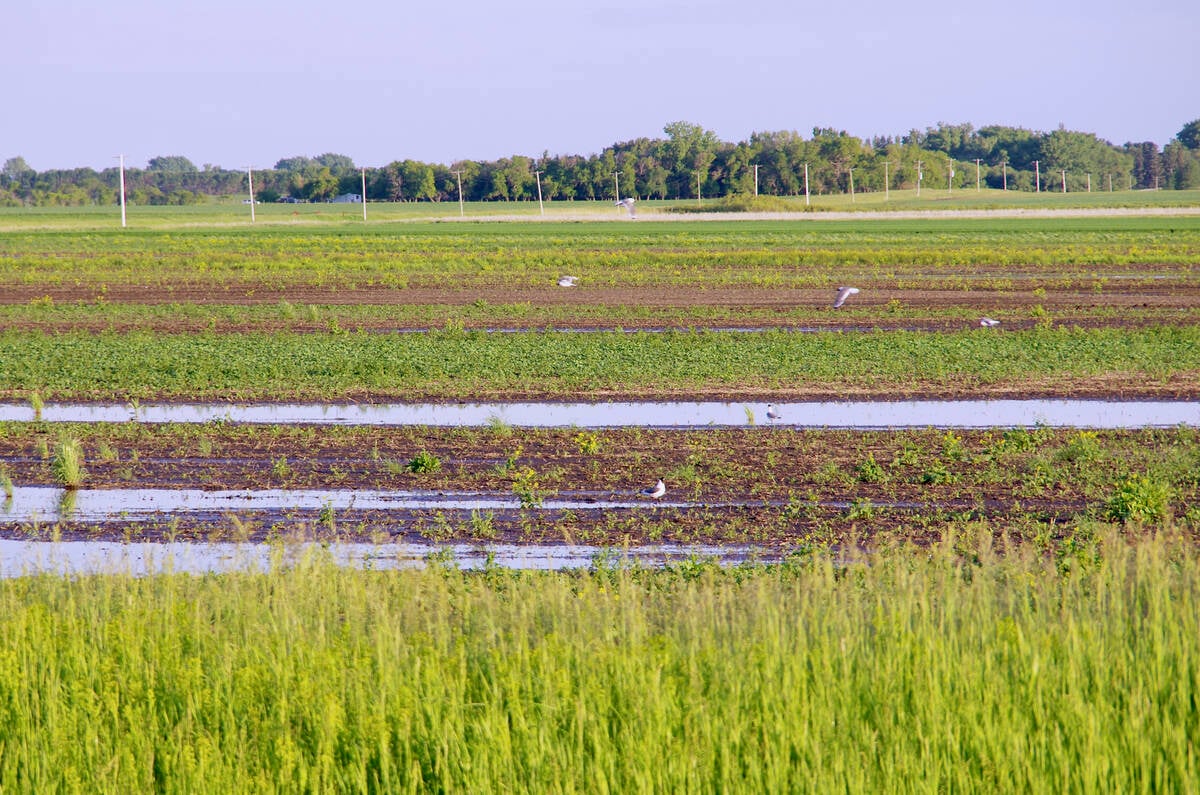
Sulfur presents its own challenges. It’s highly variable across fields and concentrated in saline areas. A soil test might show high sulfur levels but, if the next crop coming onto that field is canola, farmers may still need to consider adding some.
“With sulfur, if your soil test says it’s low, you trust that it’s low. If it says that it’s high, you don’t trust that it’s high,” Riekman said. “And again, that’s just because of that potential variability issue.”
Farmers can use the Prairie Nutrient Removal Calculator online to determine how much phosphorus and other nutrients their crops removed at harvest. A 40-bushel canola crop pulls about 31 pounds of phosphorus per acre, Riekman said.
Soil traits also affect yield
Nutrients also aren’t the only things of note in a soil test.
Salinity levels matter, especially for sensitive crops like soybeans and corn. A reading of just 1.0 on a standard lab test can start cutting yields. High carbonate levels combined with salinity increase the risk of iron deficiency chlorosis in soybeans, Riekman noted.
The soil expert has previously spoken on the quirks of salinity readings in soil tests. Most commercial soil tests are one-to-one tests, but paste tests — often used in research, and which indicate how much salt is actually around the root — are reported in terms about two times higher than the standard commercial tests. Producers with a one-to-one test result will have to double their number to compare it to research results.
Soil pH also affects phosphorus availability. At neutral pH around seven, phosphorus is most accessible. As pH rises above 7.5, calcium ties it up. In high-pH soils, as many soils in Manitoba are, banding phosphorus fertilizer reduces contact with soil and keeps more of it available.