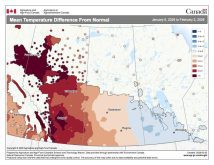
As promised in previous columns, in this article we will dig into the snowfall data across parts of agricultural Manitoba this winter. While the data is interesting, what really jumps out at me is just how poor of a job we do measuring winter precipitation. I know I have already vented a little bit on this before, but you would think that as technology gets better, the data collected would get better too. I remember doing research using data going back over 100 years for various locations across the Prairies. It seems that the further back you went, the more reliable and consistent the readings were. Rarely was there missing data. Today, missing data is becoming a constant problem. Makes sense: use technology instead of people, technology breaks and you get no readings until someone discovers it, then eventually fixes it. OK, enough of that.
Read Also
Forecasting spring 2026 weather on the Prairies
What weather can farmers expect across Manitoba, Alberta and Saskatchewan as they head into seeding? Plus: a lesson on what makes the seasons turn
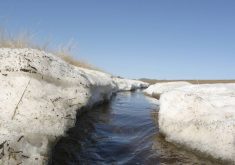
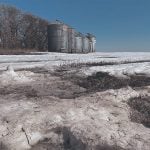
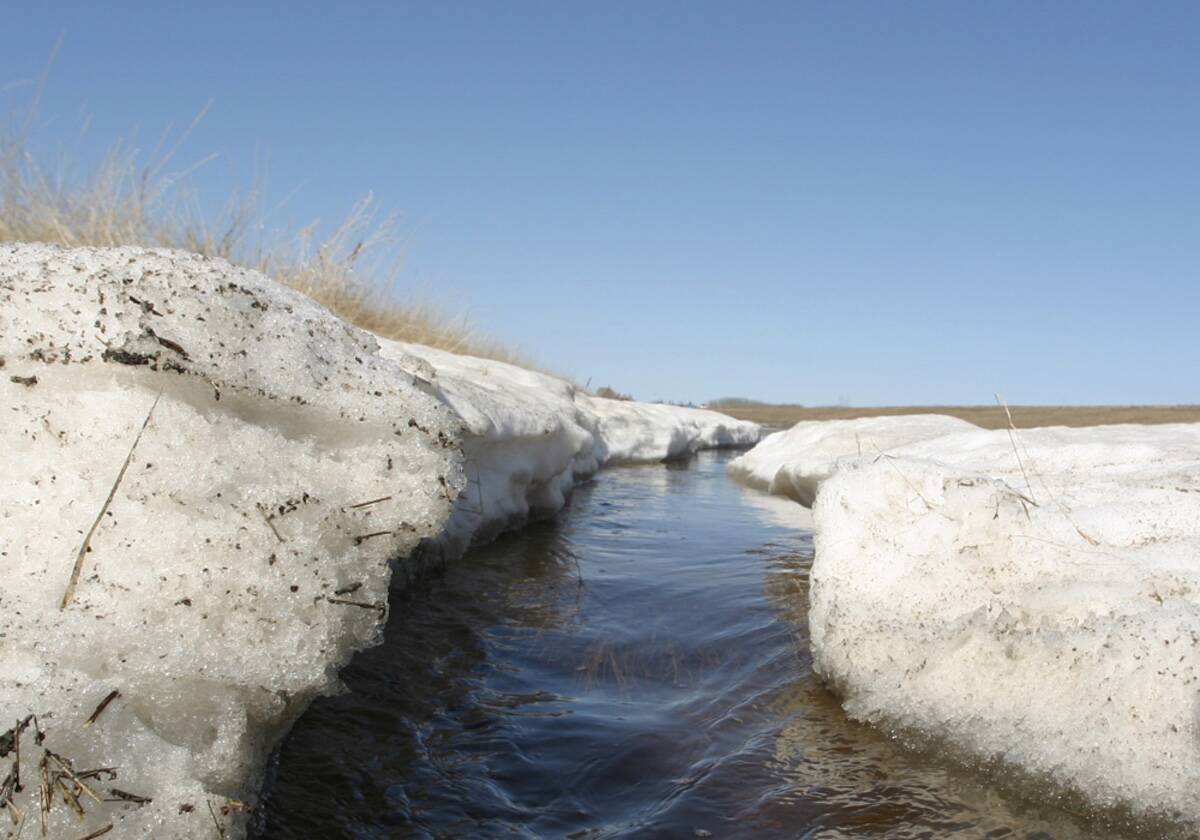
Luckily for us, we have so far dodged any big spring snowfalls (knock on wood) and the melt has been proceeding at a good pace. The question that has been asked, discussed and even argued over is: just how much snow did we see this winter? As you may have already concluded from my earlier articles, calculating snowfall is not an easy thing to do. For this dive into the data, I once again relied on the three main locations: Dauphin, Brandon and Winnipeg. I went back through the data provided by Environment Canada and pulled out all the total precipitation and snowfall measurements I could find. Before I present this table of data, here are few points that you should know.
For Dauphin, there are two reporting stations provided by Environment Canada: Dauphin and Dauphin CS. For me, it seems the Dauphin station undermeasures precipitation. For example, in December, Dauphin CS reported 12 mm of water-equivalent snowfall whereas Dauphin reported just 0.7 mm. So, for that reason I only used Dauphin CS.
In Brandon it appears all is well. Not only does it report total precipitation, but it also reports total snowfall — and the two measurements are different! They are not simply a 10:1 ratio. Well done Brandon! For this reason, I tend to have a higher confidence in this data as it seems someone out there is on top of things — although I suppose I may be wrong.

Winnipeg is a whole different matter. Winnipeg has two reporting stations from its airport: Winnipeg CS and Winnipeg Intl. I use Winnipeg CS as the Winnipeg Intl usually has missing data, especially precipitation. I do find that Winnipeg CS seems to under-report precipitation, especially in the winter. For this reason, I also added in the downtown location known as Winnipeg Forks. Finally, Winnipeg has a site that reports precipitation that includes snowfall amounts know as Winnipeg Charleswood 2. I wrote a little bit about this site in our last issue. I have included this data in the above table. This same data is also available in a graphic form for those who prefer a visual representation over tables.
Looking at the entire dataset, you can see that both Winnipeg and Brandon did indeed see notable amounts of snow this year. Brandon reported about 150 cm of snowfall, which equated to about 112 mm of water. Winnipeg’s values ranged from 86 cm at the airport to 177 in Charleswood, with The Forks coming somewhere in between. Personally, since I live close to Winnipeg, I am leaning toward The Forks as being the best representation for Winnipeg’s snowfall. I have taken some measurements in a few places within the city and out at my place (averaging out the values, of course) and they all come close to The Forks amount. Dauphin, if the data is reliable, was the least snowy of the three locations, reporting 79 cm of snow or about 82 mm of water.
If you look at the data monthly, you will see that January and/or February were the snowiest months across all three regions. December was also snowy in Brandon and in Winnipeg, depending on which readings you use. November was also snowy in the Winnipeg region, but mild weather after the snow limited the amount of snow on the ground. Overall, the four main winter months from December to February saw either near- or above-average amounts of snow in the Brandon and Winnipeg regions with Dauphin coming in either near or slightly below average.
So, whether you believe all the data or not, we did see significant snowfall this winter, at least across these three regions. I am a little leery about the 177 cm of snow reported for the one city of Winnipeg location, but amounts in the 110- to 150-cm range for Brandon and Winnipeg seem reasonable. So far, March is on track to see near-average precipitation as long as we can keep missing the major spring storms that have been winding up across the central U.S. Until the next issue, let’s hope this slow spring melt continues.