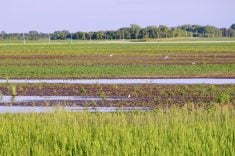
What was on almost everyone’s mind at the start of this winter was the ongoing drought across our region. Hopes were high that we wouldn’t see a repeat of last winter and after a fairly early dump of snow, those hopes were bolstered. Then that first dump of snow partially melted away and the first three weeks or so of December didn’t bring much in the way of new snow, leaving people to think, “Here we go again.”
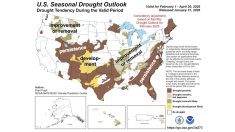
Since then, the snow machine has been pretty consistent. The question often raised around drought is, just how does a region get out of it? Sometimes one big storm comes along, often referred to as a “drought breaker,” bringing so much precipitation that previous deficits are wiped out. The problem with these events is that often conditions will return back to what they were before the drought-breaker event and the drought slowly returns.
Read Also
VIDEO: What climate change data gets wrong about the Prairies
Precipitation, not temperature, may be a better gauge of climate change impact on the Prairies, says director of the Prairie Adaptation Research Collaborative.
Most of the time, drought conditions are slowly eroded as one small system after another brings precipitation to a region. Whether that precipitation comes as rain or snow, these little systems are easier to handle and can provide, over time, the same amount of precipitation as a drought-breaker event. Massive rain or snowstorms cause all sorts of problems on their own, and when it comes to rainstorms, much of the precipitation often flows away before it can be absorbed. Little systems coming on a fairly regular basis not only soak in better but may also mean that there is a good chance the weather pattern that brought the drought conditions has changed. This doesn’t mean that drought conditions can’t return, but it is a good sign of what may lie ahead.
Since the snow-making machine started going in late December, we have seen several shots of light to moderate snowfall which is a good thing; we need the moisture. The discussions I am overhearing now are about just how much snowfall have we actually received. One viewpoint that seems to be gaining momentum is that we have a lot of snow and that people are running out of room to put the snow when they are out shovelling. While we do have much more snow than we did this time last year, I figured it was time to look at the numbers to see just how much snow we actually have so far and compare this to our long-term averages.
Water equivalent
First of all, determining snowfall amounts is tricky. It is a byproduct of the nature of snow and wind that makes snowfall difficult to measure. As we all know, heavy, wet snow has a lot more water in it than light, fluffy snow. To make up for this, snowfall is usually converted into water-equivalent amounts by melting the snowfall and measuring the amount of water. The typical conversion factor or ratio is 10 to one (10:1), meaning 10 cm of snow would be one cm of water, or 10 cm snow = 10 mm water. In colder weather this ratio will often go to as high as 20:1. Take the snowfall event that hit a large portion of southern Manitoba on Jan. 17-18. Snowfall amounts of 15 cm ended up with water-equivalent amounts of only around seven to eight mm.
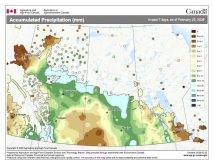
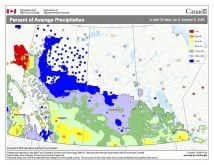
With this in mind, here you’ll see an overview of precipitation amounts so far this winter across southern and central Manitoba, using Winnipeg, Brandon and Dauphin as our reporting centres. I have created several graphs (see at top of page) to try and visualize this winter’s precipitation. The first graph shows how much precipitation has fallen so far this winter (November to Jan. 20), then compares this to the average amount over this time period along with the average amount over the whole winter (November to the end of March). Looking at the graphs you can see that both the Winnipeg and Dauphin regions have seen close to average precipitation so far this winter, while the Brandon region has seen a little above average. No region is close to being at the average for the whole winter, but with two months to go, there is still plenty of time for more precipitation.
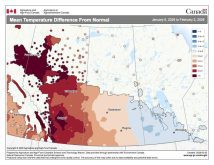
The next three graphs show the monthly precipitation comparisons for each of these three locations. In the Winnipeg region, a wet November is the reason why this winter’s precipitation is near average as December was below average — and if no more precipitation falls in January, it too will be below average. The Brandon region started off a little below average in November but has seen above-average amounts in both December and January. Dauphin saw amounts that were a little below average in November and December but above average in January. What I do have to point out is since there are still 10 days left in January as I write this, the January amount could go up.
In these graphs I have included the average amounts expected in both February and March. On average, February is the driest month across our region, with most locations not seeing much more than 10 mm of water-equivalent precipitation. March, on the other hand, with a return of warmer and moister air masses brings an increase in precipitation.
To wrap it up, have we seen a tonne of snow this winter? No, we are right around average. The low snowfall amounts over the last few years just make it seem like we have a lot of snow. Have we broken out of the drought? No. We have made some good inroads and the weather pattern seems to have changed to a wetter pattern, but we would have to see this continue for at least the next two months before we start to see a possible end to the drought. I must admit, though, having a good amount of snow on the ground right now does help to ease the drought worry.