In my last column, we finished up our look at the top Canadian weather stories of 2021. Since then, the top weather stories from around the world have come out and not surprisingly, the top story was the late-June/early-July heat wave that hit Western Canada and the northwestern United States.
Now I don’t want to spend another article going over top weather stories, but I do want to add in one point about the heat wave that just struck me when I read it. We know that this was a historic record-breaking heat wave and I tried to emphasize this in the articles. If you still need more convincing of just how historic this heat wave was, here is a clip from an article written in the Yale Climate Connection:
“More all-time heat records were broken by at least 5 C (9 F) during the heat wave than in the previous 85-plus years of world weather record-keeping, going back to July 1936, when the hottest summer in U.S. history brought the previous most extreme heat wave in world history.”
Read Also
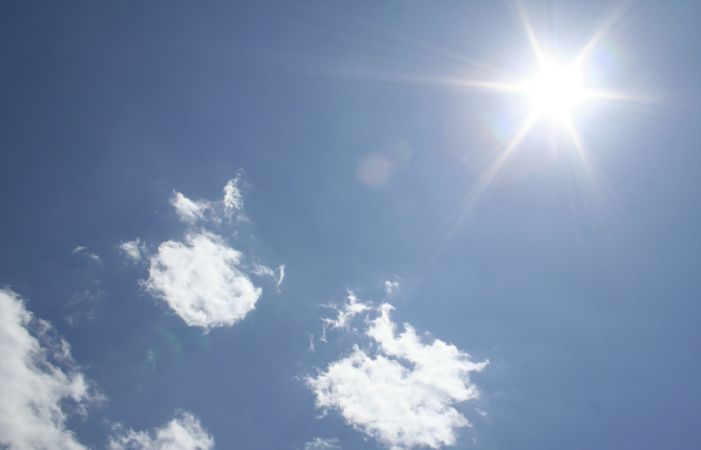
Why is the sky blue?
The colour of the skies, on the Prairies and elsewhere, tells the story of the paths sunlight takes as it enters Earth’s atmosphere, Daniel Bezte writes.
Enough said. In this week’s article I think it is time for us to take a very quick look back at our weather in 2021 and see how the weather numbers for the whole year added up. Then we need to dive into the much-anticipated long-range weather outlook — will we see a warm or cold spring? How about this summer?
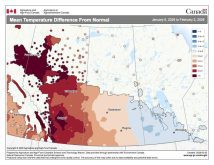
Looking back at 2021, I think it could be summarized as a dry “up and down” year. We all know it was a dry year, that much is obvious. What I mean by an “up and down” year is while we saw some really warm periods, we also had one really cold period, and a couple of cool periods. If you put those two facts together, it won’t be surprising that 2021 saw temperatures across southern and central Manitoba that were warmer than average — but maybe by not as much as you might think.
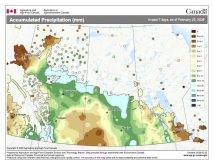
The average temperatures for 2021 ranged from 4.5 C in Winnipeg to 3.3 C in Brandon. Comparing these to the long-term average, Winnipeg came in 1.5 C above average, while both Brandon and Dauphin came in at 1.1 C above average. Looking at precipitation for the year, Brandon was the wet spot when it came to total precipitation, with 474 mm, only about 40 mm below average. Dauphin reported 353 mm, about 130 mm below average. Winnipeg reported a little more at 383 mm, but since Winnipeg is historically a wetter region, that amount resulted in the city coming in about 140 mm below average.
Looking back at each of the months, the table here provides a few of the highlights.
Forecasts
OK, on to the long-range forecasts. As usual we will start off with the almanacs. The Canadian Farmers’ Almanac looks to be calling for cold weather in February and possibly March and April, along with above-average precipitation as it mentions snow, stormy, and wet weather fairly often. The Old Farmer’s Almanac calls for warm weather from February right through to May. Its precipitation forecast is for near- to slightly below-average amounts from February to April with well-above-average amounts in May.
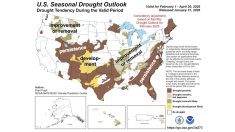
Moving on to the computer models: NOAA calls for both near-average temperatures and precipitation from February right through to May. Actually, its forecast calls for equal chances of either being above or below average for both temperature and precipitation. Its precipitation forecast calls for near- to above-average amounts in all four months. This is of interest, as I don’t remember the last time the NOAA model has shown this for our region.
Meanwhile, the GFS model’s latest forecast predicts slightly below-average temperatures in February and March followed by near- to slightly above-average temperatures in April and May.
As for the Canadian model or CanSIPS model, it calls for below-average temperatures for all four months, with the coldest months compared to average being February and May. Precipitation looks to be near to above average in all four months, with the best chance of seeing above-average amounts in May.
Lastly, my forecast. There is a lot to think about for this forecast — not a lot of consistency between the weather models, except maybe for precipitation. I’m going purely on gut instinct and calling for near- to slightly below-average temperatures along with near- to slightly above-average precipitation across all four months. I also think we will continue to see big swings between very warm and very cold temperatures.