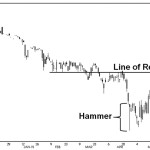
A hammer materialized on the December oat futures chart on Monday, April 27, 2015. Hammers are reversal patterns that appear at market bottoms on candlestick charts and are bullish, as they are said to be “hammering out a bottom.” The hammer represents a period in the market where an intraday sell-off is met with strong


