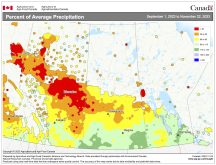
What has been dubbed “summer in March 2012” has now finally come to an end. This rare March heat wave stretched from southeastern Saskatchewan across southern Canada all the way to the eastern seaboard and southward into most of the eastern United States. Last week I explained what conditions came together to bring us this extraordinary heat wave; this week we’ll try to come to some understanding of just how unique or unusual this heat wave was.
First of all, I just have to say how lucky we are that this heat wave hit when it did. Just imagine what this would have felt like if the same thing happened in July or August? The easiest way to make a comparison would be the fact that most places experienced the warmest March temperatures ever recorded. If this occurred during July or August we would have seen temperatures in the mid- to upper 40s — not something I would like to see! Also, we are lucky most of this heat went into melting snow and thawing the ground. Only a few plants came out of dormancy. Farther east and south of us, all this heat has forced most plants out of dormancy, with many locations seeing fruit trees flowering. Giving the fact that it is still early spring, the chances for a severe frost in these areas are very likely.
Read Also

Global humanitarian aid slashed by one-third
Humanitarian aid around the world was cut by a third in 2025 and Canada is one of the culprits.
I have received several emails asking me just how this heat wave compares to previous records and in particular, just how far out of the usual temperature range this heat wave was. Before I try to explain this I think I need to go back and readdress the idea of “usual temperature range.”
Those of you who have read my column over the years understand that I really don’t like the idea of using a “normal” to try and describe the temperatures for any given day. Using the term normal implies that if a place does not experience that temperature then the temperature is unusual — either above or below the normal for that date. This is far from the truth: temperatures for any given date are usually equally divided between above-normal temperatures and below-normal temperatures. The definition of average is to add all these values together and then divide them by the total number of values. Since temperatures tend to follow what’s known as a bell curve when you calculate the average temperature, the above-average temperatures are typically cancelled out by the below-average temperatures. Simply comparing or looking at how far above or below average the temperature is doesn’t really help us compare or realize just how warm or cold a day is, especially when we compare ourselves with other cities.
This is why most climatologists use a temperature range, or what is known statistically as a standard deviation.Statistically, if a data set (such as temperature data) is evenly clustered around an average, we can use standard deviations to help explain just how far away from the average the data is. One standard deviation takes in about 34 per cent of all the values either above or below the average, or about 68 per cent of all the data. Two standard deviations take in about 47.7 per cent of the data both above and below the average, or about 95.4 per cent of all values. So, when I show you the temperature range for a given period, about 95 per cent of the time we have seen values within this range.
One in 10,000
Now back to the summer in March 2012. When it peaked in Manitoba most locations experienced all-time record highs for the month. If we looked at these temperatures in relation to standard deviations, it would have come out nearly four standard deviations from the average. Mathematically, this means the odds of seeing these types of temperatures are around 0.01 per cent, or about one in 10,000 times. Converting this to years — which is a little erroneous, considering this is only based on about 140 years’ worth of data — you would come out to about one in every 500 years.
If we look farther east into the heart of the heat wave, there are places that experienced temperatures that were four to five times the standard deviation. This equates to once in over 4,000 years (about 0.001 per cent)! There are places in Ontario, Michigan and Atlantic Canada that not only broke record-high temperatures for March, but did so for several days in a row. There were places that had overnight lows that easily beat the record high for that day! In Canada, the number of record highs that were broken during this heat wave is almost unimaginable. In Winnipeg alone we broke eight records over a 10-day span. Multiply this by all the places in Manitoba, Ontario, Quebec, New Brunswick and Nova Scotia and the numbers are truly unfathomable.
The question now on everyone’s mind is, will we see more of this type of weather in the months to come, or will we see a “payback” period? You’ll have to wait until next week for our first glimpse at that answer.


