The first of this three-part series looked at the current state of farm revenue and risk management and how big data analysis can play a greater role. This time I’d like to explore some of the myths and misperceptions of agriculture hedging.
To understand this topic we have to ask ourselves, for farm marketing and hedging purposes, are agriculture markets trend driven? Does seasonality exist? Do computer models and indicators work? Let’s look at some numbers.
Read Also
VIDEO: Manitoba farmer tests controlled traffic farming to fight soil compaction and flooding
Manitoba farmer Alex Boersch wants to improve the stability of his crop yields. He’s been experimenting with controlled equipment traffic on his fields
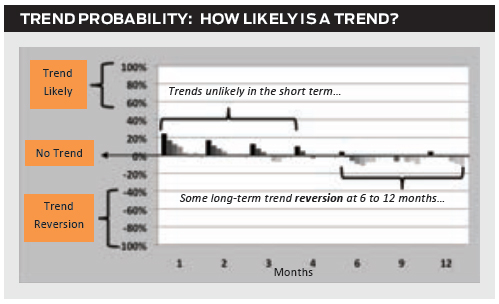
Trend probability
Serial or auto-correlation is a measure of how much a series of prices is linked, connected or correlated, to itself over time. Think of Newton’s First Law of Motion: a body in motion tends to stay in that same motion.
It is a tool for finding repeating price movements in the same direction based on past movement and the likelihood of that trend continuing. It ranges from +100 per cent correlation, indicating prices are moving lockstep in the same direction, to a -100 per cent correlation, meaning prices are moving in the exact opposite direction.
After crunching all the numbers from one to 12 months, across all the markets important to Canadian farmers, the results support some shorter-term (one to two months) price trendiness but with only a 20 per cent correlation of them moving in the same direction over time. Over longer periods of time, between six to 12 months, farm commodities often tend to move in the slightly opposite direction. This concept, known as trend reversion, suggests that a six-month up period will be followed by a six-month down period.
Bottom line, consistent strong trends are unlikely based on the correlation of price movements over time. It’s not that trends don’t exist; it’s just that they don’t happen often enough on which to base a farm hedging program.
Trend persistency
In 1906, British civil servant Harold Hurst worked as a hydrological consultant in Egypt, to estimate water flow levels and predict how much the Nile River flooded from year to year. The Hurst Exponent he developed is now used as a measure of long-term trends of time series.
It quantifies the relative tendency of a data series to either move back to the average or to move strongly in one direction. It measures the predictability of a trend, ranging from a low of 0 to a high of 1:
- 0.00 – reversion to the mean; up followed by down or down followed by up; “anti-trend”;
- 0.50 – completely random; no trend;
- 1.00 – tendency to move in one direction; high price followed by higher prices, low prices followed by lower prices; strong trend persistency.
Based on this analysis using data from 1986-2015, most farm commodity markets are close to random and do not exhibit strong consistent trends.

Some markets, like hogs, are slightly trend reverting in the short term, meaning they are likely to move up and then down, or down and then up, week to week, month over month, while the Canadian dollar, like most currencies, tends to have large moves over extended periods of time from five to 10 years.
Bottom line, markets can and will trend, however, this analysis shows that while some longer-term 12-month trends do persist, particularly in the loonie, shorter-term one-, three- and six-month patterns tend to be highly random. Essentially, trend analysis results alone are not strong enough on which to base a farm hedging program.
Trend seasonality
Another common and popular indicator associated with commodity markets is the idea of seasonality where markets tend to follow recurring patterns every year.
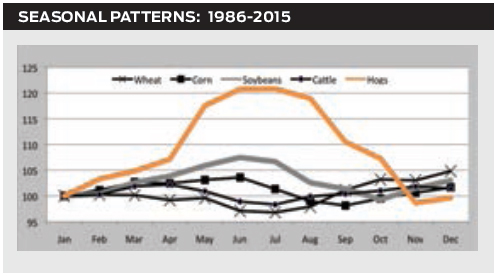
In the grain markets, decisions are often based on folkloric sayings like, “prices go down in the fall because of harvest pressure,” (historically, wheat has been slightly higher at harvest time — see chart) or anecdotal evidence that there is “a spring rally to buy acres.” Instead of just following the conventional wisdom, let’s see what the data from the past 30 years (1986-2015) tells us:
- While grain and livestock markets do have some seasonal patterns over the calendar year, they are not significantly stronger or weaker than any other six- or 12-month period throughout the year. The only market that does show a consistently strong seasonal pattern is hogs.
- Most movement in either direction measures only between four per cent to eight per cent from seasonal high to seasonal low. While not insignificant, it is not a consistently large enough pattern to count on; this is the case 80 per cent of the time.
- Furthermore, the largest up or down moves have not consistently coincided with the associated strong or weak seasonal time frame. These big moves tend to occur randomly throughout the year. The one exception again is hogs, which more regularly make their biggest up moves during the seasonally strong summer months and biggest down moves during the seasonally weak winter months.
Bottom line, there is no consistent seasonal price pattern strong enough to bet the farm on.
Trend following
Trend following trading systems worked very well during the inflationary 1970s and 1980s, since many commodities were going straight up. While there will always be trends in commodity prices, in the last 10 to 15 years, they have been less predictable, not as easy to implement, and therefore less profitable.
Back-testing uses historical data and computer software to analyze the profitability and risk of a trading system. Back-testing studies were performed on thousands of systems with the Trading Blox Trading System Software using almost 20 years of data on farm commodities: wheat, soybeans, corn, oats, cattle, hogs.
The results? Overall, it was challenging to find a system that generated strong enough performance on which to base a hedging program.
Additional important practical conclusions from this extensive analysis include:
- While some futures trading systems were modestly profitable (five per cent to six per cent gains), they also had big drawdown losses of 50 per cent to 80 per cent and large capital requirements to support the system.
- Some of the trading systems may result in large margin calls and require too much capital, making them impractical for a farm business to implement.
- Finally, most trading software tests only futures-based systems and not options strategies. In general, there is less financial analysis and quantitative studies done on options strategies so you can use this to your advantage.
Bottom line, after testing a wide range of trading systems, the conclusions are that most:
- Demonstrate marginal performance, especially when taking the risk into consideration.
- Are inconsistent year to year.
- Are not practical enough to implement as a farm hedging program.
So if all these approaches don’t yield any strong consistent marketing results, where do you go from here? This will be the topic in the third and final part of this series.