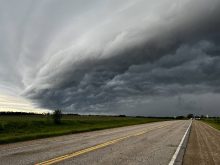
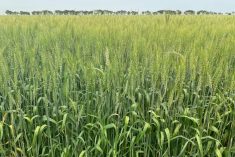
For most of us July has been hot and dry. There have been a few exceptions as thunderstorms have dumped some significant rains over a few areas. This hot, dry weather is in stark contrast to the cool, wet spring and early summer a large portion of agricultural Manitoba experienced this year. The question most of us are trying to answer is just how wet this spring was?
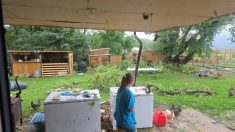
With the record flooding occurring over southwestern Manitoba, and with water levels on several lakes near or above historic levels, the general talk is that we have never seen so much rain. For some areas this is true, while other areas it has just been an average year. So I guess the real question is why has there been so much flooding this year?
Read Also

June brings drought relief to western Prairies
Farmers on the Canadian Prairies saw more rain in June than they did earlier in the 2025 growing season
To try and figure this out I started off by looking at the total rainfall during the April to June time period for several locations across agricultural Manitoba. I’ve placed this data into the following table. I tried to ensure that there were at least a couple of stations from each region, but sometimes the lack of any long-term records for a station meant that I could not use it. The table shows the total amount of precipitation for each of the three months in millimetres, along with the total amount of precipitation. I have also included the record amount of precipitation recorded for each station along with the year that the record occurred. Finally, I highlighted any records that have been broken this year.
From the table you can see that three stations, Brandon, Hamiota and Virden, as far as I can tell from the data available to me, broke their all-time precipitation records for this three-month period. Souris came very close to breaking its record. All of these stations are located in southwestern Manitoba, so it is not surprising that this region experienced the flooding it did.
What I found interesting about these records was both the number of records that were broken along with the location. You would think that when a precipitation record is broken at one location, then there would be a good chance that other stations in the same area would also break their records, but this is not usually the case.
We all know that when it comes to rainfall especially, one location can see a huge amount of rain while another location only a few kilometres away may see very little rain. If we look at the existing records for these locations before this year, you will see that there were only two records from the same year. So the fact that we have three records broken this year and that they cover a fairly large geographical area is quite unusual.
These record rainfalls also fell in southeastern Saskatchewan and over parts of North Dakota. Nearly all this water ends up flowing northward into lakes Mani toba and Winnipeg and driving the water levels in these lakes up. Normally events like this would not send lake levels to these dangerously high levels, but we have seen several years of heavy rainfall across different parts of Manitoba. These wet years have filled any areas that could normally act to absorb excess water, forcing more and more water into the lakes.
In a couple of weeks I will take a look at the long-term trends in rainfall amounts across Manitoba to see how rainfall amounts over the last few years compare to historical amounts – stay turned!
———
Arborg
Brandon CarmanGrandview HamiotaPortage RussellSouris SteinbachSwan Valley Virden
Winnipeg
April
54.2
64.0 43.6
12.2 38.0
51.1 13.4
36.0 49.4
3.8 53.0
50.0
May
94.4
99.6 72.0
78.0 161.6
73.2 86.0
167.6 81.0
48.4 124.6
55.0
June
84.4
157.4 59.2
72.0 109.8
49.0 85.4
152.0 95.6
73.2 137.8
45.5
Total
233.0
321.0 174.8
162.2 309.4
173.3 184.8
355.6 226.0
125.4 315.4
150.5
Record
293.9
307.4 320.0
282.7 294.3
311.6 309.1
359.0 277.6
242.8 286.5
379.2
Year
2005
1953 2005
1998 1999
1944 1919
1991 1990
1999 1998
1896