I said I would continue our look at the top weather stories of 2020, and I guess that is what I am going to do, in a way. My top weather story of 2020 was the projection that globally, 2020 was going to come in tied as the warmest year on record. Well, the results from the main reporting agencies on global temperatures (NOAA, NASA, European Copernicus Climate Change Service, Japan Meteorological Agency, the University of Alabama in Huntsville) are now in and statistically, 2020 did come in tied with 2016 as the warmest year on record.
Read Also
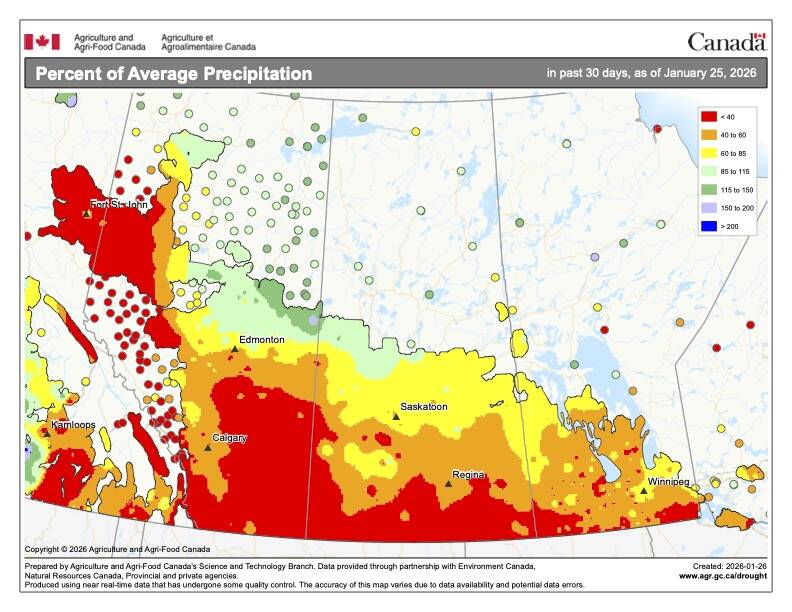
What’s the weather for last half of winter 2025-2026?
A last look at 2025 temperature and precipitation on the Prairies, plus what weather forecasters expect through to spring 2026.
NASA, Copernicus and Japan rated 2020 as tied with 2016. Meanwhile, NOAA ranked 2020 as the second-warmest year on record, coming in just 0.02 C cooler than 2016, with a mean global temperature that was 0.98 C above the 20th-century average, or about 1.25 C above the pre-industrial average (according to Copernicus). The University of Alabama at Huntsville, which uses satellite measurements to calculate temperatures for the lowest eight kilometres of the atmosphere, also reported that 2020 was the second-warmest year in its 42 years of record.
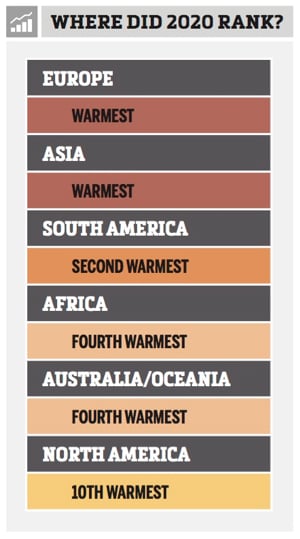 If we look at different parts of the world, the table at left shows how they ranked, as listed in Jeff Masters’ article on Yale Climate Connections.
Of interest is the fact that 2020 saw the warmest year on record for ocean heat content in the upper 2,000 metres of the world’s oceans — this, in spite of the fact that there was a moderate to strong La Niña event during the second half of the year, which would normally result in a cooling. Of note, it’s estimated that more than 90 per cent of the increased heat from global warming goes into the world’s oceans, with the remaining 10 per cent going into heating the atmosphere. To try and understand just how much energy the oceans are absorbing, it is reported that there were 211 to 234 zettajoules more heat in the oceans in 2020 than the 1981-2000 average. For comparison, if you totalled up all the energy humans used in 2010, it would come out to 0.5 zettajoule.
I came across a second interesting weather article over the last couple of weeks. The average temperatures and precipitation that you see used in day-to-day forecasts, and in comparisons of current weather to past weather, are based on averages of 30-year periods. The current 30-year period we use is 1980 to 2010. Since we are now entering a new decade, our climate normal or averages will soon be updated to reflect the 30-year period of 1990-2020. The graphic you see here this week shows the change in temperature of the current normal or average that is used compared to the new one. You can see that across the north and over much of Europe there will be a significant increase of 0.5 C or more in the reported average temperatures. In North America, the increases are small, and in the middle of the continent there is actually expected to be a small drop in average temperatures. What needs to be noted is that the negative changes in average temperatures go from 0.0 to about 0.25 C cooler than the current averages, while the warmer-than-average values go up to 0.75 C or more warmer than average; also, there are a lot more areas that warmed than cooled during this period.
If we look closely at Manitoba, Winnipeg and eastern regions are slightly warmer than average while western areas are the same or slightly cooler. A second graphic that I didn’t have room to include this week shows that across southern Manitoba, most locations will see between eight and 11 months with new warmer averages.
Not sure what next issue’s topic will be. If you have something you would like me to write about, email me at [email protected].


