I don’t know about you, but October just seemed to fly by. Maybe it was the nice weather, or just being overly busy, either way it is hard to believe it is November already and winter is just around the corner — or is it?
Since it is the end of the month that means it is time to do our monthly look back and then peer ahead to see what the next month or two might have in store for us.
I do not think it will come as a surprise to anyone that October was a warmer-than-average month. With some record-breaking temperatures earlier in the month, followed by average or slightly below-average temperatures during the last half of the month, the overall average ended up rather high.
Read Also
Why is the sky blue?
The colour of the skies, on the Prairies and elsewhere, tells the story of the paths sunlight takes as it enters Earth’s atmosphere, Daniel Bezte writes.
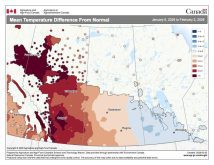
All three of our main reporting locations across agricultural Manitoba had mean monthly temperatures in October that were well above average. Temperatures ranged from about 3.5 C above average in the Dauphin region to around 4.0 C in the Winnipeg region. We must go back to last March to find a month that had temperatures that far above average.
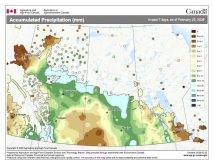
Next up is precipitation. After a wetter-than-average September, there was a lot of hope that October would continue with this trend. The Dauphin region came in right smack on average with about 36 mm of precipitation. Brandon, for the first time in a while, was the dry spot, coming in a little below average with about 25 mm. The Winnipeg region was the wet spot thanks to an area of rain that brought between 10 and 15 mm late in the month. Winnipeg’s total was about 47 mm, which is around 10 mm above average.
Overall, it was a warm October across southern and central Manitoba with average to slightly above-average rainfall. Looking back at the different forecasts for the month I would have to give the win to… me! For the first time in a long while my forecast of above-average temperatures, especially during the first half of the month, and near- to above-average rainfall was the closest. The CFS model came in second with a call for temperatures to be about 5 C above average with precipitation coming in near average.
Now it is time to do our look ahead. In my last article we discussed La Niña — the fact that it has redeveloped, what exactly it is, and how it develops across the Pacific. We then discussed how, through a process known as teleconnections, the change in weather or pressure patterns across the Pacific can and does impact the weather downstream (our part of the world).
If you listen to the news or have read some articles about this, you may have heard that La Niña usually impacts the winters in our region by making them colder. Well, you know I had to check this out to see if it is true, and after looking at all the La Niña winters in Winnipeg since 1938, the answer is yes and no.
I crunched the numbers for all the winters (November to February) going back to 1938 for Winnipeg. I then compared the winter temperatures to the long-term average and determined the difference from average, or the temperature anomaly for that winter. Then I did a quick count of how many La Niña winters were colder or warmer than average. It turns out that out of the 25 La Niña winters, 16 or 64 per cent were colder than average while nine or 36 per cent were warmer than average. So, there you go, the stories are right, or are they?
I then looked at when the colder- and warmer-than-average La Niña winters occurred and plotted this along with the strength of the anomaly (see this issue’s graphic) and was a little surprised by the results. If you look at the graph you can see that from 1938 to the early 1970s 10 of the 11 La Niña winters were colder than average or about 91 per cent. After this period there were 14 La Niña winters with only six being colder than average (43 per cent) and eight being warmer than average (57 per cent). Not only does it seem that La Niña winters are trending towards a greater chance of above-average temperatures, but the extent or strength of the warming has increased significantly.
What does it mean for this winter’s weather outlook? I’m not sure, but I wouldn’t count on the fact that this winter looks to be another La Niña winter to necessarily mean a cold winter. Let’s see what the different forecasts are now calling for.
Both the almanacs haven’t changed as they produce their forecasts well ahead of time. The Old Farmer’s Almanac is calling for a cold and snowy first half of winter followed by a warmer and snowy second half. The Canadian Farmers’ Almanac seems to be calling for near- to slightly below-average temperatures with near- to above-average precipitation. NOAA’s forecast is remaining safe with a call for near-average temperatures and precipitation. Next up is the CFS model. It is currently calling for a warm start to winter with above-average temperatures in November and December, followed by below-average temperatures in January and February. Precipitation looks to be near average with above-average amounts staying just to our south. The CanSIPS model forecasts near-average precipitation with temperatures flipping back and forth between below average one month starting in November, then above average in December, flipping back to below and above average in January and February. Finally, my forecast. I am leaning towards the CanSIPS model which flip-flops the temperatures back and forth over the winter, but I think we will end up seeing slightly above-average snowfall.