The Weather Vane is prepared by Daniel Bezte, a teacher by profession with a BA (Hon.) in geography, specializing in climatology, from the University of Winnipeg. Daniel has taught university-level classes in climate and weather and currently operates a computerized weather station at his home near Birds Hill Park, on 10 acres he plans to develop into a vegetable and fruit hobby farm.
Contacthimwithyourquestionsandcommentsat [email protected].
Read Also

June brings drought relief to western Prairies
Farmers on the Canadian Prairies saw more rain in June than they did earlier in the 2025 growing season
———
Copyright 2011 Agriculture &Agri-Food Canada
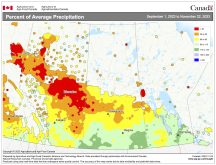
1 Month (30 Days) Percent of Average Precipitation (Prairie Region)
January 17, 2011 to February 15, 2011
Prepared by Agriculture and Agri-Food Canada’s National Agroclimate Information Service (NAIS). Data provided through partnership with Environment Canada, Natural Resources Canada, and many Provincial agencies.
< 40%
40 -60% 60 -85% 85 -115% 115 -150% 150 -200%
200% Extent of Agricultural Land Lakes and Rivers
Produced using near real-time data that has undergone initial quality control. The map may not be accurate for all regions due to data availability and data errors.
Created: 02/16/11
This issue’s map shows the amount of precipitation that has fallen across the Prairies over the last month
compared to the long-term average. From the map you can see that except for a few pockets both Manitoba
and Saskatchewan have seen fairly dry weather with most areas receiving less than 85 per cent of average
precipitation. Southern and northwestern Alberta has been a little wetter during this period receiving near-to
above-average amounts.