This week I wanted to do the monthly weather review and see what the models predict this fall, but I am waiting for two weather models to update their forecasts.
In the last column, we discussed several factors that can result in extreme rainfall events. These ranged from atmospheric moisture to triggers such as orographic or frontal lift, instability, speed of storm systems and the training of thunderstorms.
Let’s wrap up the topic of extreme rainfall by looking at different weather patterns that tend to be associated with these events and consider how changing weather patterns might contribute.
Read Also
Forecasting spring 2026 weather on the Prairies
What weather can farmers expect across Manitoba, Alberta and Saskatchewan as they head into seeding? Plus: a lesson on what makes the seasons turn
Record rain
Let’s first look at some of the rainfall records across southern and central Manitoba.
There are several types of rainfall or precipitation records: yearly precipitation, which includes rain and snowfall; and monthly rainfall totals, daily totals or storm totals.
When analyzing data, the yearly, monthly and daily totals are relatively easy. Storm totals are more difficult because the precipitation extends over one or more days and it is hard to look back at the information that has been saved as daily data and then try to determine whether it was one large single event or several events over two or more days.
Here are some single-day rainfall records I’ve found. I only looked at stations that had more than 50 years of rainfall data and included stations that recorded more than 100 millimetres of rain in one calendar day. I created this list in 2015 and to the best of my knowledge, it is still current.
| Location | Amount (mm) | Date |
| Pinawa | 168.4 | June 14, 1973 |
| Pierson | 160 | June 29, 1935 |
| Morris | 152.4 | July 13, 1887 |
| Winnipeg | 152.4 | June 26, 1901 |
| Morden | 150 | Aug. 17, 1995 |
| Portage la Prairie | 137 | Aug. 16, 1985 |
| Steinbach | 132.8 | July 4, 2002 |
| Russell | 114.3 | June 28, 1919 |
| Deloraine | 111 | June 20, 1926 |
| Ninette | 109.7 | Aug. 12, 1957 |
| Sprague | 109 | Aug. 3, 1985 |
| Cypress River | 107.6 | Aug. 14, 1987 |
| Arborg | 107 | Aug. 29, 1992 |
| Emerson | 104.1 | July 11, 1957 |
| Virden | 103.6 | June 9, 1942 |
| Brandon | 102.9 | June 2, 1953 |
| Dauphin | 100.3 | June 18, 1956 |
| Minnedosa | 100.1 | June 23, 1922 |
Recipe for rain
Extreme or heavy rainfall often results from a combination of factors. There may be training thunderstorms, but if there is little available moisture, you will not get extreme rainfall. The same thing goes for a strong area of low pressure. It might have lots of moisture and plenty of instability, but if it is moving fast, rainfall totals will not be extreme.
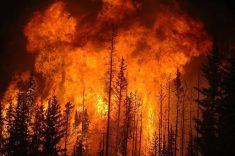
In the one-day rainfall records, you may notice they all occur in June, July or August, which is thunderstorm season. Thunderstorms that bring extreme rainfall usually have several conditions that come together. There will be plenty of moisture, atmospheric instability, some form of front providing lift and slow speeds or training of storms.
The two main conditions almost always present for extreme rainfall are plenty of moisture and slow movement. On a warming planet, these two conditions look to become more prevalent.
In the last article, I discussed how a warmer atmosphere and ocean is leading to an increase in available atmospheric moisture. That doesn’t mean we won’t have dry conditions. A warmer atmosphere can hold more moisture, but a dry and warm atmosphere will pull more moisture from a region through evapotranspiration.
Overall, it looks like the atmosphere can and will hold more moisture, and that moisture will be available to produce rainfall.
There is also emerging evidence that a warming planet is leading to a slowing of weather systems and development of more blocking patterns. Blocking patterns occur when certain configurations of highs and lows block the movement of weather systems.
We remember blocking patterns when they bring long periods of warm, dry weather, but they can also bring long periods of cool, wet weather. It depends on where you are in relationship to the block.
Why the slow down? As the planet warms, the poles warm significantly faster than the equatorial regions. This lessens or weakens the temperature gradient between these two regions. This gradient is the driving force behind most atmospheric circulation, such as the jet stream. As those weaken, systems will move slower and the pattern becomes more meandering.
Think of a river. If it is flowing down a steep hill, it tends to stay relatively straight. When it is flowing slowly across a flat region, like the Prairies, it curves back and forth. The same thing happens with the flow of the atmosphere, and when it gets curvy, it can get stuck in that curve until the curve breaks off.
We will likely see more shift between dry and wet patterns. Sometimes it will be within short times: dry one month and wet the next. Other times, it will occur over longer periods: several months to a year or more of wet weather followed by a long period of dry weather.
It looks more and more like our weather will get tougher to predict, but we will do our best to try.