Chart analysts keen on the lookout for telltale signs of a market top in canola were rewarded when a reversal pattern called a double top appeared at the height of the rally in July 2015.
Double tops and bottoms are chart formations which appear in the futures markets. Once completed, they are a reliable indicator of a change in trend, especially when they develop at a new high or low of an extended move.
In March 2015, my monthly column explained a double bottom formation that occurred when the canola futures market turned up from a low of $410 per tonne. In today’s column I will explain the double top formation, which alerted canola producers to the impending downturn from $540.
Read Also
Manitoba cattle prices April 1
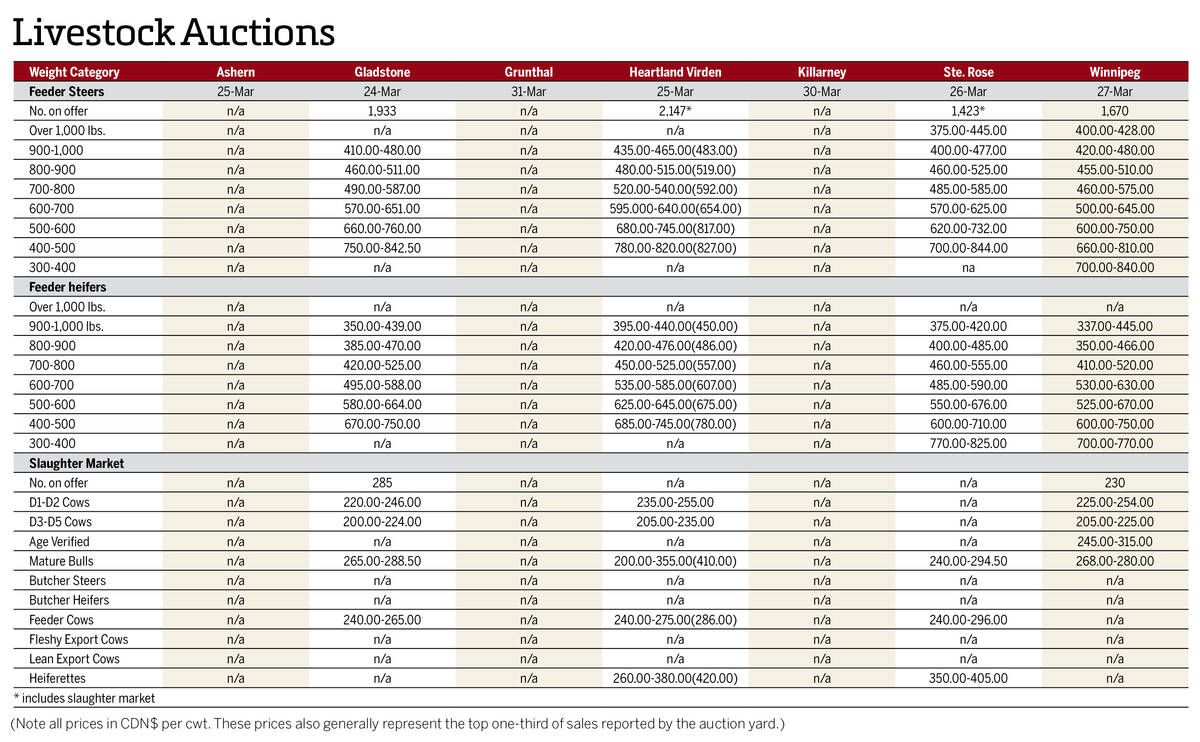
Here’s what cattle were selling for in Manitoba from March 24-31, 2026. Four of the seven main livestock auction marts held sales.
Double top
A double top begins to take shape when prices advance to a new high for the move. This is illustrated as point A in the accompanying chart. A pullback then sets in, which is referenced as point B. A second rally (C) brings prices back up to approximately the highs of the first rally, followed by a price decline. The double top formation is completed when prices fall beneath the reaction low (B) that occurred between the two tops.
When reversal patterns coincide with other technical indicators and formations, their reliability is greatly enhanced. In this instance, the futures price also dropped below the lower boundary of an uptrending channel, which is in itself an indication of additional weakness.
Double tops can provide us with a forecast of the extent of a market’s weakness. Simply measure the distance from the double tops down to the reaction low in between them and subtract this distance from that low to arrive at a minimum downside objective. (Point A-C) 539.20 – (B) 512.00 = 27.20. (B) 512.00 – 27.20 = (D) 484.80. The $484.80 objective was achieved on August 12, 2015. The November futures contract has since lost another $30 per tonne.
Market psychology
The first top develops after a sustained price rise. It will coincide with a growing willingness on the part of longs with large unrealized profits to cash in their earnings. The market stalls as the supply of contracts for sale exceeds the demand and the price begins to fall.
Short sellers jump in, convinced that the upward move has gone far enough. The market continues to decline until the price drop causes sellers to withdraw. The bull market is still intact, so when the price decline falters, buyers step in and prices once again begin to move higher.
At approximately the level of the first top, longs with a short-term outlook are quick to take profit. Longer-term traders who failed to take profits when prices made the first top, and sat through the entire correction, are likely to be watching more closely now that the market has come back up to its recent high. They won’t let the opportunity to take profit slip so easily through their fingers this second time around. Finally, there are the ever-present potential short sellers who are waiting to sell the proverbial high of the move.
At the high price level, the selling eclipses whatever buying remains and the market begins to lose ground and liquidation of long contracts becomes an inevitable reality. As prices fall with increasing acceleration, new shorts will also enter the market.
Trend reversal patterns identified by technical analysis are an invaluable tool for selling canola at or near the high before the market turns down. Canola producers who recognized the double top formation were able take advantage of the opportunity to sell old- and new-crop canola before the market turned down.
Send your questions or comments about this article and chart to [email protected].