Cotton prices on Nov. 4 reached $1.4052 per pound, the highest price since this fibre began trading 140 years ago. Prices have doubled in the past 12 months amid a supply shortage and increasing demand, especially in emerging markets in Asia. The U.S. Department of Agriculture estimates 2010-11 world ending stocks will be down 26 per cent from 2008-09.
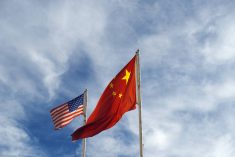
Poor weather in China, the world’s largest cotton producer, and devastating floods in Pakistan have the textile trade worried supplies may fall short of global demand. This has prompted India, the world’s second-largest producer and exporter of cotton, to hold off on exports until it is certain it has enough for its own mills.
Read Also
Pulse Weekly: War, weather affecting Manitoba pulse prospects
Manitoba pulses could be affected by the ongoing war in Iran as well as spring weather, said the former executive director of Manitoba Pulse & Soybean Growers.
China is the world’s largest consumer of cotton and its mills are rushing to replenish inventories because of their reduced crop. Fund buying is also responsible for driving prices higher.
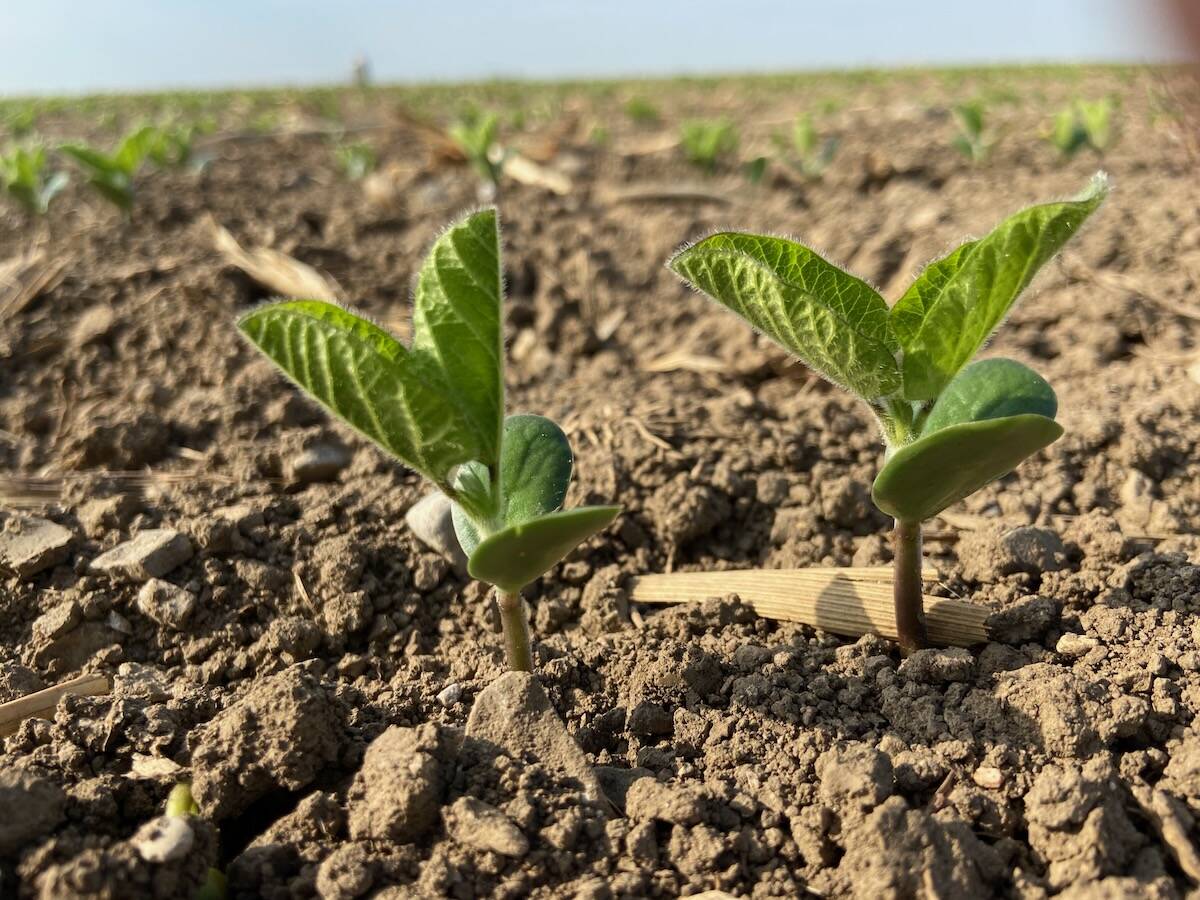
High cotton prices are causing soybeans to compete for acres, which lends underlying support to soybean values. (*) U.S. farmers planted 11 million acres to cotton in 2010. This is four million less than in 2006. With record-high prices, tight supplies and growing demand, the question on our mind is, how many acres of soybeans and corn will switch over to cotton in the spring of 2011?
In studying this long term chart, I’d like to share a couple of observations with you:
- cotton prices have the potential of moving up to a new higher trading range, and
- prices are entering the vertical blow-off phase of a bull market.
Similar to the grain and oilseed markets in 2008, cotton has the potential to move up to a new higher trading range. This doesn’t mean prices will go up and stay up, but now that cotton is putting in a higher high, I wouldn’t be surprised if this market establishes a new higher low.
After all, it’s been 37 years since cotton prices last realigned to a new higher trading range. Prior to the early 1970s, prices were below 40 cents and contained in a narrow trading range identified by (A) and (B) in the accompanying chart.
In 1973 prices pushed through resistance (A) and exploded. They then found support at approximately the same level (D). In the following years, prices never went back down to the previous low (B). When prices push above an old level of resistance (A), this now becomes a new area of support (D). Therefore, just as (C) became the next area of resistance, the area at or just below (C) may prove to provide support, possibly in the $.70 to $.80 area.
I believe cotton is in the vertical blow-off stage of a bull market. This market could peak with a V-top. These reversal patterns form very suddenly. Dynamic and substantial price drops often follow V-top formations.
Market psychology: Since a market is likely to be in a vertical rise prior to the V-top, the longs are reaping profits and the shorts are being battered. Suddenly, a dramatic shift in psychology drives the longs to cover (sell back) their positions. They find they have plenty of company, as potential new shorts also want in. Emotions probably run higher in a V-top than in any other chart formation.
When the pattern occurs in the absence of any news or explanation, longs may at first misjudge the turn as being merely a correction. With profits on the books, they tend to wait and see what happens — a big mistake! The market is propelled lower by aggressive new shorts, with longs trying to make the best of a rapidly deteriorating position.
For now, the trend is up, but sooner or later cotton prices will peak and turn back down. New-crop prices are 45 cents less in anticipation of an increase in acreage.
Join me online for an audiovisual presentation about this article and chart.
(*) — Editor’s note: This article originally appeared in the Manitoba Co-operator on Nov. 11, 2010, page 12.
— David Drozd is president and senior market analyst for Winnipeg-based Ag-Chieve Corp. The opinions expressed are those of the writer and are solely intended to assist readers with a better understanding of technical analysis. Visit us online for more grain marketing ideas and educational tools, or call us toll-free at 888-274-3138 for a free consultation.