To the relief of livestock producers, soybean meal prices have started to soften.
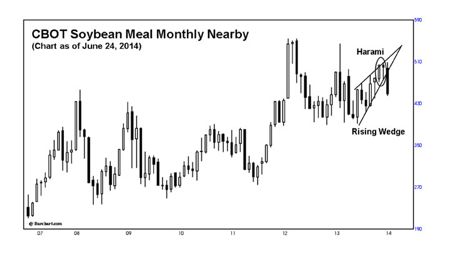
At the end of May, a harami alerted producers to a downturn in the meal market. A harami is a reversal pattern often seen on a candlestick chart. This particular harami materialized at the height of the rally on the CBOT soybean meal monthly nearby chart and is illustrated in the accompanying chart.
The harami is similar to an inside day used in bar chart analysis. However, this interpretation suggests a change in trend. The small body of the harami must be contained by the real body preceding it.
Read Also

Feed Grain Weekly: Demand rises despite war uncertainty
Demand is ongoing and prices are slowly rising for feed grains despite the war in Iran, said Brandon Motz, owner and manager of CorNine Commodities in Lacombe, Alta.
A rising wedge formation also appeared in the accompanying chart. In June, prices slipped below the lower boundary of this pattern, which indicates additional weakness. Prices will generally go back down to where the rising wedge began.
Rising wedge
A rising wedge is an upward slanting formation which contains all price activity between its converging boundaries. The essential feature distinguishing a rising wedge from any of the various triangles (symmetrical, descending & ascending) is the accentuated slope of the pattern.
The rising wedge pattern implies a minor or intermediate turn. The pattern is completed when prices break out from their converging boundaries. For a rising wedge this means a decline through its lower boundary. Wedges occur with a fair degree of frequency in the futures markets. As a rule, after the pattern is completed prices should retrace all of the vertical movement comprising the wedge.
Market psychology: Rising wedges will often begin with a high volume day marking at least a temporary end to the current price move. In the case of a rising wedge, this move will have been down.
Typically, the market’s decline has had the speculative longs on the run. Their selling exodus peaks and the wedge begins to form. With the weakest longs now sold out, additional selling pressure at prevailing prices is absent. All remaining longs in the market have made the financial and psychological commitment to at least hold for a rally. With selling abated, prices begin to recover. Progress is slow but the pattern is clear: a series of higher minor highs and lows. At first, normal profit taking by the shorts triggers the rally, but soon, bargain hunters make their presence felt by buying on the now small price setbacks. The market’s ability to rally to higher minor highs attracts additional buyers. Lows begin to rise faster than the highs, giving the pattern its narrowing shape. The converging boundaries of the rising wedge signify its limited duration.
Speculative buying continues to rally the market but volume fails to grow. This is a reason for caution. There is no great quantity of contracts for sale overhead, but each time buying diminishes the market backs down. Price advances need buying in order to be sustained. The advances will progressively gain less ground until all the potential buyers have been satisfied. At this point, instead of simply backing off, the market begins to fall under its own weight. Recent longs, as well as new shorts now comprise the sellers. Volume will normally increase at this time, confirming that the rising wedge pattern and the rally have been completed.
Old-crop soybean values are beginning to slip, as the fear of running out in the U.S. is waning. Although 2013-14 stocks are tight, USDA is estimating U.S. farmers will seed a record area to soybeans in 2014. The crop is in good shape and this is weighing on soybean and meal values.
By studying the charts and using technical analysis, producers can gain the upper hand in knowing when markets are about to change direction.
Send us your questions or comments about this article and chart.
— David Drozd is president and senior market analyst for Winnipeg based Ag-Chieve Corp. The opinions expressed are those of the writer and are solely intended to assist readers with a better understanding of technical analysis. Visit Ag-Chieve online for information about our grain marketing advisory service and to see our latest grain market analysis. You can call us toll free at 1-888-274-3138 for a free consultation.