Fears of a global economic slowdown have nervous investors heading for the sidelines. As a result, equity markets have been under pressure since peaking in early May 2011.
The two-week reversal that occurred at the height of the 27-month-long rally in the S+P 500 gave savvy investors an indication this bull market was vulnerable to running out of steam. This reversal pattern proved to be all the more reliable when it simultaneously materialized in the Dow Jones Industrial Average and the Nasdaq 100.
Two-week reversal
Read Also

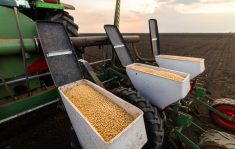
CBOT Weekly: USDA predicts declines in planting intentions
Declines in projected planting intentions for 2026/27 were not as big as the market expected, after the United States Department of Agriculture released its estimates on March 31. The USDA also issued its quarterly grain stocks report with stocks for soybeans bigger than anticipated, while those for corn were smaller and wheat virtually matched the average trade guess.
On the first week the market advances to new highs and closes very strong at or near the high of the day. The following week, prices open unchanged to slightly higher but cannot make additional upside progress. Quantity selling appears early in the week to curtail the advance and prices begin to turn down. By week’s end, the market drops to around the preceding week’s lows and closes at or near that level.
Market psychology: The two-week reversal is an abrupt change in sentiment. On the first week the longs (traders who have purchased stocks in anticipation of higher prices), are comfortable and confident. The market’s performance reinforces the expectation for greater profits.
The second week’s activity is psychologically damaging. It is a complete turnaround from the preceding week and shakes the confidence of those who are still long the market. The immediate outlook for prices is quickly put in question. Longs respond to weakening prices by exiting (selling) the market.
The recent stock market decline gained momentum when the S+P 500 index broke below 1260. This is the point at which the index penetrated the lower boundary of the uptrending channel and is illustrated in the accompanying chart (A).
In turn, sell stop orders were triggered, which drove indices further down. Sell stops are orders investors and traders place with brokers to protect their long positions from becoming unprofitable or to limit their losses.
One can expect additional weakness in the stock markets now that not only is the S+P 500 index trading below the uptrending channel, but so are the DJIA and Nasdaq 100 indices. One can’t rule out the occasional dead cat bounce (minor rally in a bear market), but we would expect these markets to begin putting in lower highs and lower lows, which is indicative of a bear market.
If you look back to the global economic crash in 2008, long liquidation in the stock markets spilled over to commodities as heavily leveraged investors sold their long commodity positions to repay their outstanding debts in the equity sector.
Crude oil dropped from a high of $147 a barrel in July 2008 to $32 in December 2008. Corn, which peaked at a historical high $7.65 in July 2008, dropped to $2.90 in December 2008.
Some analysts believe it will be different in 2011-12, with commodities such as corn continuing to rally on strong demand and tight stocks in the face of an economic downturn. Admittedly, there have been inverse relationships between commodities and stocks in years gone by as investors seek out more favourable returns, but one has to wonder if this will be the case when crude oil has lost 34 per cent of its value since peaking at $115 a barrel in May 2011.
Similarities now exist with both crude oil and equities peaking in May 2011 and breaking down below the lower boundaries of their respective uptrending channels in August 2011. With equities and crude oil under pressure, how long could it be before other commodities like corn turn down on long liquidation too?
With all the noise in the marketplace, don’t lose sight of the fact that grain prices are relatively high now and profit isn’t realized until your grain is priced.
Send us your questions or comments about this article and chart.
— David Drozd is president and senior market analyst for Winnipeg-based Ag-Chieve Corp. The opinions expressed are those of the writer and are solely intended to assist readers with a better understanding of technical analysis. Visit Ag-Chieve online for information about grain marketing advisory services, or call us toll-free at 1-888-274-3138 for a free consultation.