The realized net income of Canadian farmers totalled $7.3 billion in 2012, up 31.7per cent from 2011, as farm cash receipts rose more than operating costs, Statistics Canada reported Tuesday.
The increase follows gains of 56.3 per cent in 2011 and 16.9 per cent in 2010, the government agency said in a release.
Realized net income is the difference between a farmer’s cash receipts and operating expenses, minus depreciation, plus income in kind.
Realized net income increased in Newfoundland and Labrador, Nova Scotia, Quebec, Ontario, Saskatchewan, Alberta and British Columbia.
Read Also

ICE weekly: War news driving canola markets
Canola futures broke below their nearby trading range as a selloff in crude oil weighed on prices. While seasonal price trends point higher, direction will continue to come from developments in the Middle East.
Farm cash receipts
Farm cash receipts, which include market receipts from crop and livestock sales as well as program payments, rose 9.2 per cent to $54.2 billion in 2012, following an 11.9 per cent gain in 2011.
Market receipts increased 10 per cent to $50.7 billion in 2012. Crop receipts, which rose 15.6 per cent to $29.9 billion, were the largest contributor to the gain. Receipts from livestock products increased 2.8 per cent to $20.9 billion. Livestock receipts accounted for 41.1 per cent of market receipts in 2012, compared with 55.7 per cent 10 years earlier.
Stronger prices for grains and oilseeds played a major role in boosting crop receipts. For example, wheat receipts, excluding durum, rose 18.4 per cent in 2012, mostly because of a 19.4 per cent gain in prices. Canola receipts were up 7.3 per cent to $8.2 billion, on the strength of a 6.3 per cent price increase. The 56.2 per cent rise in soybean receipts and the 28 per cent gain in corn receipts were both the result of increased marketings and prices.
World grain prices began rising during the second half of 2012, as drought in the United States and other countries reduced world grain stocks.
Crop receipts rose in every province except Prince Edward Island (-0.2 per cent) and New Brunswick (-6.5 per cent). A drop in potato marketings contributed to the lack of growth in crop receipts in the two provinces.
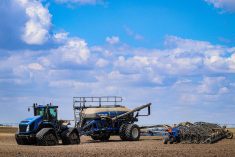
Crop receipts rose 24.9 per cent in Alberta in 2012. Increased prices and marketings for both canola and wheat helped push crop receipts higher.
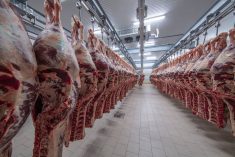
Overall livestock receipts increased in all provinces. Cattle receipts rose 4.2 per cent, as a reduced supply of market animals boosted cattle prices. Conversely, hog receipts decreased 2.3 per cent to $3.8 billion, as prices fell 3.4 per cent.
Receipts for producers in the three supply-managed sectors (dairy, poultry and eggs) increased 3.4 per cent. A 9.2 per cent rise in egg receipts exceeded gains for chickens (+5.2 per cent) and dairy products (+1.7 per cent).
Program payments fell one per cent to $3.4 billion in 2012. Better growing conditions led to a 22.1 per cent decline in Saskatchewan that more than offset payment increases of 17.4 per cent in Quebec and 12.9 per cent in Alberta.
Farm expenses
Farm operating expenses (after rebates) were up 6.7 per cent to $40.8 billion in 2012, following an 8.3 per cent increase in 2011 and a 2.1 per cent decline in 2010.
Sharp increases in seeded acres on the eastern Prairies, together with moderate price gains, pushed fertilizer expenses up 20.2 per cent. Producers in Saskatchewan and Manitoba had seeded notably fewer acres in 2011 as a result of flooding. Feed expenses were up 9.9 per cent as feed prices rose throughout 2012.
Depreciation charges rose 4.3 per cent in 2012, resulting in total farm expenses of $47 billion, up 6.4 per cent from 2011.
Total farm expenses grew in every province in 2012. The largest percentage increases occurred in Saskatchewan (up nine per cent), Manitoba (+8.5 per cent), and Alberta (up eight per cent).
Total net income
Total net income reached $7.1 billion in 2012, a $1.1 billion gain over the previous year. The largest increases were in Manitoba (+$1 billion), Ontario (+$232 million) and Quebec (+$172 million), while Saskatchewan and Alberta saw declines.
Total net income adjusts realized net income for changes in farmer-owned inventories of crops and livestock. It represents the return to owner’s equity, unpaid labour, and management and risk.
Note: Realized net income can vary widely from farm to farm because of several factors, including commodities, prices, weather and economies of scale. This and other aggregate measures of farm income are calculated on a provincial basis employing the same concepts used in measuring the performance of the overall Canadian economy. They are a measure of farm business income, not farm household income.
Financial data for 2012 collected at the individual farm business level using surveys and other administrative sources will soon be tabulated and made available. These data will help explain differences in performance of various types and sizes of farms. — Statistics Canada release