(Resource News International) — There were few surprises in the grain and oilseed stocks in all positions report for the period ended March 31, released Monday by Statistics Canada.
The numbers were expected to be quickly overshadowed by more dominating news such as the euro-zone bailout and Tuesday’s supply/demand updates from the U.S. Department of Agriculture, market participants said.
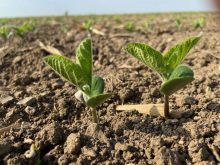
The main number of interest was canola, with the on-farm and in commercial position figures below the year-ago level.
Statistics Canada pegged total supplies of canola at 5.438 million tonnes, which was below 6.149 million at the same time a year ago.
Read Also

Pulse Weekly: India to make pulse tariff announcement on Tuesday
Canadian peas and lentils could experience some shifts come March 31, as India is set make an announcement on its pulse import duties that Tuesday.
“Essentially there were two things at play here,” said Ron Frost, a Calgary-based analyst with Agri-Trend Marketing and the Frost Forecasting Corp. “Last year’s canola production may have been a bit overstated and there has been a bit more usage of the crop not making its way into the weekly and monthly commercial figures that are available.”
With the better than expected disappearance of canola, he said, the 2009-10 ending stocks projection may be tighter than what some industry analysts are anticipating.
“To tell you the truth, with the ever-expanding domestic processing capacity in Canada and the strong export potential, there will be a need for canola area hitting the 17.2 million- to 17.5 million-acre level this spring in order to not run short of supply in the 2010-11 season,” Frost said.
Mike Jubinville, an analyst with ProFarmer Canada, called the report “lame,” indicating the report will do little to change the current outlook for the various crops.
“Will the price outlook for canola change because of the report? No; will the figures for the grains change anything? No,” he stressed.
There were few if any pre-report expectations for this particular government-issued update, he said, as numbers fell in line with most analysts’ estimates.
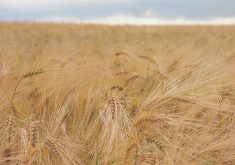
Frost felt the barley stocks number would have been on the low side, given reactions in previous years. However, with the greater availability of dried distillers grains (DDGs), there was room for barley stocks to be down, he said.
Statistics Canada pegged barley supplies on-farm and in commercial position as of March 31 at 5.096 million tonnes, compared with 6.007 million at the same time a year ago.
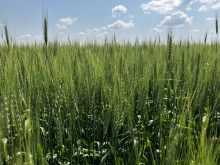
Frost said the same could be said about wheat and even, to some extent, oats, but again, there’s an abundance of feed alternatives.
The durum number was also on the large side, given the absence of export business being put on the books, Frost said. The issue here is that a lot of the durum may end up in Western Canada’s feed channel instead, downplaying the smaller wheat and oats estimates.
Statistics Canada pegged all wheat stocks on farm and in commercial position at 15.684 million tonnes, down from 16.252 million at the same time a year ago. Durum stocks were put at 4.625 million tonnes, up from 3.755 million, while oat supplies in Canada were 1.936 million, compared with 2.657 million.
Jubinville agreed that while the quality of Canada’s durum crop is pretty high, producers are looking ahead and not seeing a lot of delivery opportunities.
“As a result, in order to generate some cash flow from their durum stocks, they have been moving some of those stocks into the domestic feed market,” he said.
Table 1. Statistics Canada grain and oilseed stocks in all positions report as of March 31, 2010, in thousands of tonnes. Source: Statistics Canada.
| On farms | Commercial | Total | ||||
| 2008-09 | 2009-10 | 2008-09 | 2009-10 | 2008-09 | 2009-10 | |
| All wheat | 10,883 | 11,771 | 4,801 | 4,481 | 15,684 | 16,252 |
| – Durum | 3,620 | 2,625 | 1,005 | 1,130 | 4,625 | 3,755 |
| Oats | 1,727 | 2,454 | 209 | 203 | 1,936 | 2,657 |
| Barley | 4,514 | 5,404 | 582 | 603 | 5,096 | 6,007 |
| Rye | 175 | 170 | 21 | 11 | 196 | 181 |
| Flaxseed | 500 | 395 | 96 | 94 | 596 | 489 |
| Canola | 4,506 | 4,997 | 932 | 1,152 | 5,438 | 6,149 |
| Corn | 4,360 | 4,600 | 1,585 | 1,413 | 5,945 | 6,013 |
| Soybeans | 755 | 603 | 645 | 620 | 1,400 | 1,2 23 |
| Dry peas | 1,875 | 1,385 | 185 | 375 | 2,060 | 1,760 |
| Lentils | 245 | 330 | 65 | 42 | 310 | 372 |
| Mustardseed | 120 | 48 | 45 | 40 | 165 | 88 |
| Sunflower | 65 | 40 | 7 | 7 | 72 | 47 |
| Canaryseed | 85 | 128 | 25 | 26 | 110 | 154 |
| Chickpeas | 55 | 97 | 10 | 10 | 65 | 107 |