
People sometimes have the wrong idea about what satellite imagery can do for agriculture, says Steve Shirtliffe, a researcher and professor in the department of plant sciences at the University of Saskatchewan, during that province’s Crop Production Show in January.
“I think there’s this idea sometimes that people think that you can just have a bunch of satellites flying around taking pictures, and you don’t need agronomists,” he said.
“Nothing could be further from the truth. You still need boots on the ground.”
Read Also

Judge clears Manitoba horse exporter
Case dismissed in Manitoba horse export trial; verdict cites shared responsibility for animal welfare during air export and reasonable doubt.
Shirtliffe has been researching crop imagery, how to use and apply current data and how to use what’s to come. There’s plenty of information to be gained from current and older aerial crop imagery, he said.
An example producers may be familiar with is the Saskatchewan crop rotation app. It uses Agriculture and Agri-Food Canada’s satellite data to identify what crop is growing where, and then stores the data and presents it to app users when they select a certain field.
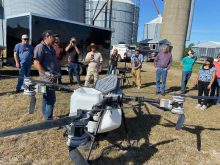
Other ways to get crop images is with drones and satellite imagery. These methods can be used to identify crop emergence and other vegetation such as weeds when paired with computer programs and artificial intelligence.
One of Shirtliffe’s projects has been mapping kochia and its spread in lentils, wheat and canola using these methods. Paired with machine learning algorithms, the collected images can effectively highlight kochia, which ise helpful in the fight against the weed, considering many herbicides don’t affect it.
Except, there’s a downside: drones and high quality satellite imagery are expensive for researchers and for farmers. That’s why Shirtliffe and his team are working on developing a system trained to identify agronomic info from satellite imagery of lower quality — and less expensive — such as through the Google Earth Engine.
Using the same ideas of identification as the normalized difference vegetation index (NDVI) and information from shortwave infrared wavelengths, the program will detect various live plant material, moisture within a plant canopy and low spots in a field, such as those that collect water or have high salinity.

“We’re doing a pretty good job, and that’s using satellite imagery that has pixels that are 10 metres in a square. So, you can’t find really small patches, but you can find a path that’s maybe as big as this seating area,” he said.
Building off these methods, Shirtliffe is currently collaborating with Paul Galpern and Christy Morrissey as part of the Prairie Precision Sustainability Network project.
Currently, the project has close to one million acres mapped. They’ve built yield maps for four years of wheat and canola in the participating areas, using remotely sensed data.
Shirtliffe recognizes that yield maps aren’t perfect, but perfection isn’t necessarily the goal — it’s to learn about a field’s spatial variability.
“What we’re trying to understand in this project is how does the yield vary within an individual field, not between fields, not between areas, but within fields — those areas that are lower yielding.”
To build this understanding, the researchers identify causes of low production such as salinity, slough areas and knolls. They also look at the yield maps, calculate potential profits and consider variable expenses that relate to the profitable areas and variance areas within a field.
The next phase of the project is to provide participating farmers with an app that features their yield data, Shirtliffe said. It will include toggles to enact the variables listed and provide potential action choices to the producer.
To create this app, they’re using the yield maps they’ve created as well as historical yield maps, satellite imagery from Google Earth Engine and federal ag department crop type maps to train the systems. The systems will also pay attention to field borders because NDVI varies between fields, as well as within them.
All this information, paired together and with added help from hydrological data from the German Aerospace Corp will create topographical and hydrological models for Western Canada, he said.